In today’s fast-paced business environment, data is everywhere. But raw data alone isn’t enough—it’s how you interpret and visualize that data that truly matters. Enter Odoo 18, the latest iteration of the beloved ERP software, which brings a suite of powerful types of charts in odoo 18 help businesses make sense of their data.
Whether you’re a sales manager tracking monthly performance, a warehouse supervisor monitoring inventory levels, or a marketing analyst studying customer behavior, Odoo 18 data visualization tools are here to simplify your life. From Odoo 18 bar charts to Odoo 18 line charts and Odoo 18 pie charts, this platform offers a variety of ways to turn numbers into actionable insights.
In this blog, we’ll take a closer look at the different Odoo 18 chart types, their unique features, and how they can be used to drive better decision-making. By the end, you’ll not only understand these tools but also feel confident using them to enhance your business operations.
Why Data Visualization Matters in Odoo 18
Let’s face it—spreadsheets stuffed with numbers can be difficult. Without the right tools, it’s easy to miss critical knowledge or waste hours trying to make sense of the data. That’s where Odoo 18 data visualizing comes in.
Visual representations like charts and graphs make complex data digestible. They help you:
– Spot trends and patterns at a glance
– Communicate insights effectively with your team
– Save time by automating repetitive analysis tasks
– Make smarter decisions backed by data
With Odoo 18 reporting tools, you can transform raw data into a story that drives action.
Types of Charts in Odoo 18
Odoo 18 offers a variety of chart types to suit different needs. Let’s explore the most commonly used ones and how they can benefit your business.
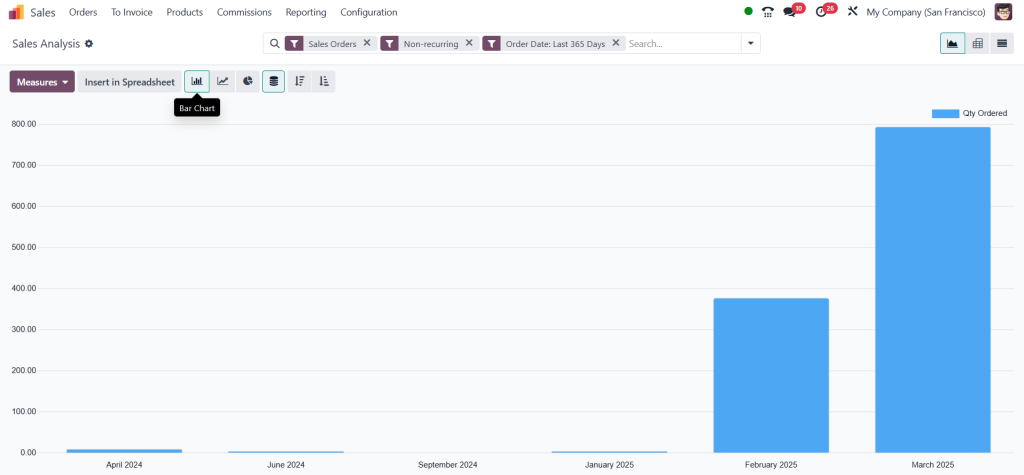
1.Odoo 18 Bar Chart
Bar charts are a classic choice for comparing data across categories. They’re straightforward, easy to read, and perfect for highlighting differences.
Key Features:
– Horizontal or vertical bars for clear comparisons
– Ideal for discrete data sets
– Great for side-by-side comparisons
Use Case:
Imagine you’re a sales manager looking to compare the efficiency of different areas. A bar chart can immediately show you which region is leading and which requires work.
2. Odoo 18 Line Chart
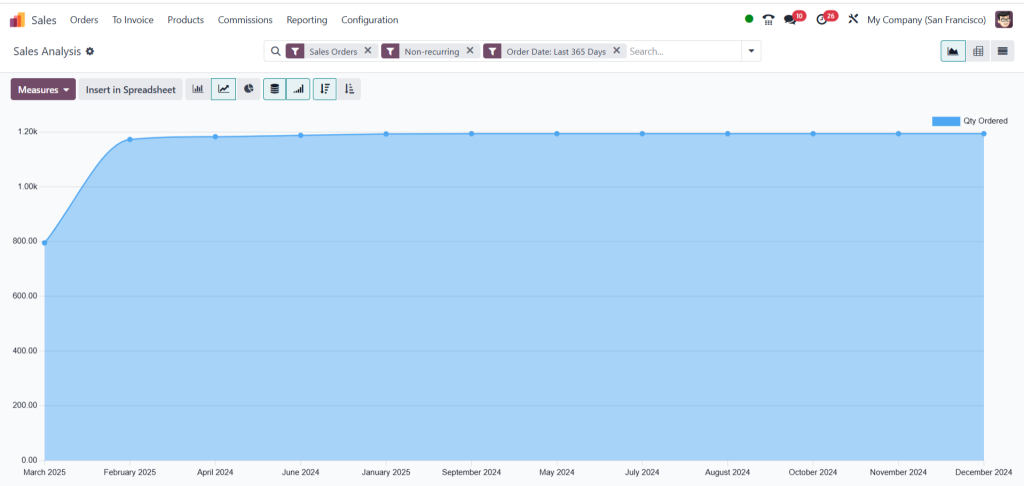
Line charts help you see how things change over time better than anything else. They connect data points with lines, making it easy to see trends and changes.
Key Features:
– Perfect for time-series data
– Shows growth, decline, or stability over time
– Multiple lines can be used to compare different metrics
Use Case:
For example, a line chart can help you analyze monthly revenue trends and identify seasonal spikes or dips.

3. Odoo 18 Pie Chart
When you need to show how parts fit into a whole, pie charts are the way to go. They’re easy to understand, look good, and are great for showing proportions.
Key Features:
– Visualizes percentages and proportions
– Easy to understand at a glance
– Best for data with a limited number of categories
Use Case:
Assume you are evaluating the market share of your company. A pie chart will obviously demonstrate your organization’s relative performance to rivals.

4. Odoo 18 Graph View
Odoo 18 truly shines in the graph view. It’s a flexible tool that lets you create customized charts tailored to your needs.
Key Features:
– Supports multiple chart types (bar, line, pie, etc.)
– Advanced filtering and grouping options
– Interactive and user-friendly interface
Use Case:
Need a detailed report for a board meeting? The graph view allows you to create a custom dashboard with all the metrics that matter most to your business.
Benefits of Using Odoo 18 Reporting Tools
The Odoo 18 reporting tools aren’t just about pretty visuals—they’re about making your life easier. Here’s how:
- Greater Making choices: Visual data helps you understand the larger picture and make informed choices.
- Effort Cost effectiveness: Automate monotonous work and concentrate on the important things.
- Collaboration: Convey ideas to your group to an understandable manner.
- Scalability: Depending of however huge or small your company is, these tools can expand with you.
- Customization: Modify your reports and charts to your own demands.
How to Choose the Right Chart Type in Odoo 18
What exactly you want to do will help you choose the right Odoo 18 chart type. Here’s a quick guide to help you decide:
– Bar charts are perfect for comparing data across categories.
– Line charts are ideal for tracking trends over time.
– Pie charts work best for showing proportions.
– The graph view is your go-to for custom, detailed analysis.
Transform Your Data with Odoo 18 Chart Types
Data is only worth the insights you get from it. With Odoo 18 chart types, you can turn complicated data into apparent useful visuals that drive better choices. Whether you’re using bar charts for assessments, line charts for trend analysis, or pie charts for proportions, Odoo 18 has the tools you need to thrive.