Why Project Tracking in Odoo 18 Community Deserves Your Attention
Every business runs on numbers, but not all know how to read them well.
This is your moment if you’re a project manager, team lead, or business owner operating on the Odoo 18 Community version. Tracking tasks, monitoring deadlines, and visualizing workflows need an efficient yet affordable system. And guess what? Project tracking tools like sales and purchase reports in Odoo 18 Community might be your hidden advantage. This version of Odoo, although community-based and open-source, packs powerful project management functionalities that rival paid software.
The Odoo 18 Community Edition is the go-to ERP for many because of its flexibility, no-cost structure, and active open-source ecosystem. While it’s true that this version doesn’t offer some of the enterprise-level bells and whistles, it offers a surprisingly robust set of tools to handle everyday business needs, including sales and purchase reporting in Odoo 18. When you realize that this community version can track, analyze, and present your business’s financial activity in visually digestible formats, you appreciate its true potential. It’s not just about logging transactions; it’s about turning data into strategy.
Let’s explore the unacknowledged influence of Odoo 18 project tracking tools, a feature set designed to handle complexity with simplicity, and discover the magic of managing your project like a professional.
Odoo 18 Sales Report Tutorial: More Than Just a Summary
Let’s start with sales, which is the lifeline of every business. Whether you’re running a retail shop, a service-based enterprise, or a wholesale distribution model, the ability to generate sales reports in Odoo 18 is a catalyst. Once inside the Sales module, a treasure trove of insights awaits under the “Sales Analysis” section. You can filter by customers, products, sales teams, date ranges, or countries. And here’s the fun part: you’re not just staring at columns of numbers. You’re interacting with bar graphs, line charts, and pivot tables that tell a story.
The Odoo 18 sales report tutorial doesn’t require you to be a data scientist. Everything is intuitive. Need to see which salesperson closed the most deals last quarter? Done. Are you curious about which product category is outperforming others? One click away. Do you want to export everything to Excel and present it to stakeholders? Just hit the download button. You’re never more than a few clicks away from clarity. This ease of use, combined with its powerful grouping and filtering options, makes sales reporting in Odoo 18 not only practical but almost addictive. You’ll dive into the data more often, not because you have to, but because you want to.
Odoo 18 Purchase Report Guide
Your purchasing operations are just as vital as sales. Think of purchases as the engine oil invisible, but without it, everything grinds to a halt. The Odoo 18 purchase report guide shows how rough and insightful procurement data can be. The module’s “Purchase Analysis” section dissects vendor performance, cost fluctuations, product-level ordering trends, and delivery timelines.
But here’s where the magic happens: when you notice patterns. One supplier consistently delivers late. Another offers discounts based on bulk ordering cycles. This is where purchase analysis in Odoo 18 becomes your secret weapon. You’re not just tracking costs anymore; you’re optimizing them. You’re aligning procurement strategy with sales projections and inventory flow. With each report, your business decisions become more informed, your negotiations more powerful, and your inventory more simplified.
The community version allows complete visibility through smart filters and grouping options. You can instantly compare purchase orders over different periods, track quantities ordered per product, and evaluate procurement costs by vendor. It’s like having an internal procurement analyst working silently in the background; you don’t need to hire one.
Sales and Purchase Reporting in Odoo 18
Now imagine combining the sales and purchase views. The insights start stacking up. You can spot which products sell fast but are costly to replenish or which items linger in stock despite frequent restocking. Strategy is born with this kind of sales and purchase reporting in Odoo 18. By aligning your buying behavior with your selling trends, you’re not reacting to the market but anticipating it.
Odoo 18 Community Edition doesn’t restrict you to static reports. The system has interactive graphs, pivot tables, and downloadable formats, allowing you to slice and dice your data in perfect ways for your business. If you’ve ever felt the limitations of spreadsheets or outdated legacy systems, stepping into Odoo’s reporting modules feels like a breath of fresh, analytical air.
Odoo 18 Community Reporting Features
Despite being the “free” version, the Odoo 18 community reporting features hit far above their weight. Many small and mid-sized businesses never outgrow the community edition because it already gives them the insights they need to thrive. With periodic clicks, you can create meaningful visualizations, filter results by any field, and export those insights for external reporting.
It’s this powerful yet accessible functionality that makes reporting in Odoo 18 such a valuable asset. You get immediate value without a steep learning curve. You can track profitability by salesperson, vendor reliability by delivery schedules, and product performance by category or season without leaving the ERP environment. The design is light, intuitive, and driven by business logic rather than complex jargon.
Odoo 18 Report Customization Tutorial: When Standard Isn't Enough
But what if you want more? What if the default views just don’t cut it? That’s where the Odoo 18 report customization tutorial comes into play. While the Community edition doesn’t include Odoo Studio (an Enterprise feature), it still allows for deep customization through code. If you’re technically inclined or have access to a developer, you can create custom reports using QWeb templates, XML structures, and Python logic.
Want to create a combined sales and purchase dashboard? You can. Want to auto-generate a weekly report and email it to your team? You can script that. The extensibility of Odoo means that you’re never boxed in. Whether you’re looking to tweak fonts and formats or build entirely new report types, the Community version gives you the foundation to develop your ideal reporting environment. It’s like having a customizable business microscope. You can zoom in on precisely what you need and how you need it.
Generate Sales Reports in Odoo 18 and Watch Trends Unfold
One of the most exciting parts of the process is generating sales reports in Odoo 18 regularly and seeing long-term trends emerge, such as sales seasonality, product lifecycle, and customer behavior, all becoming visible. The data starts to tell a story, and suddenly, forecasting isn’t a guessing game anymore. It’s a pattern recognition process. Your business can identify high-performers, under-performers, and unexploited opportunities with consistent reporting. It’s the difference between driving blind and directing with a GPS.
And it’s not just for executives. Sales representatives, warehouse managers, and accountants benefit when data becomes a shared language. The more you use Odoo’s reporting features, the more confident your team becomes in its decisions. There’s something incredibly authorizing about seeing the numbers and knowing exactly what they mean and what actions to take next.
How to Generate Sales Reports in Odoo 18
This section covers a complete Odoo 18 sales report tutorial:
Step 1: Activate the Sales Module
Ensure the Sales module is installed. You can do this by:
Directing to Apps > Search “Sales”
Click “Install” if not already active
Step 2: Access the Sales Reports
Go to:
Sales App > Reporting > Sales
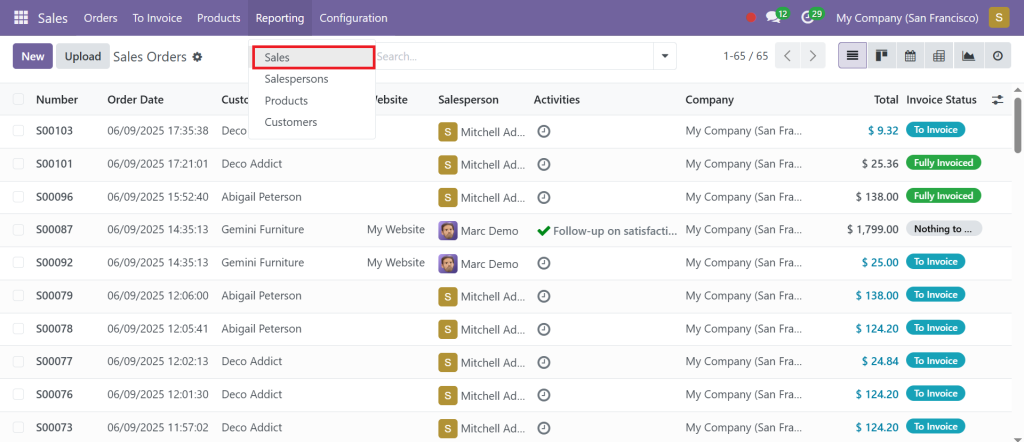
Here, you’ll see a dashboard that allows you to:
- Filter by date
- Group by customer, product, salesperson
- View totals by quantity, revenue, and margins
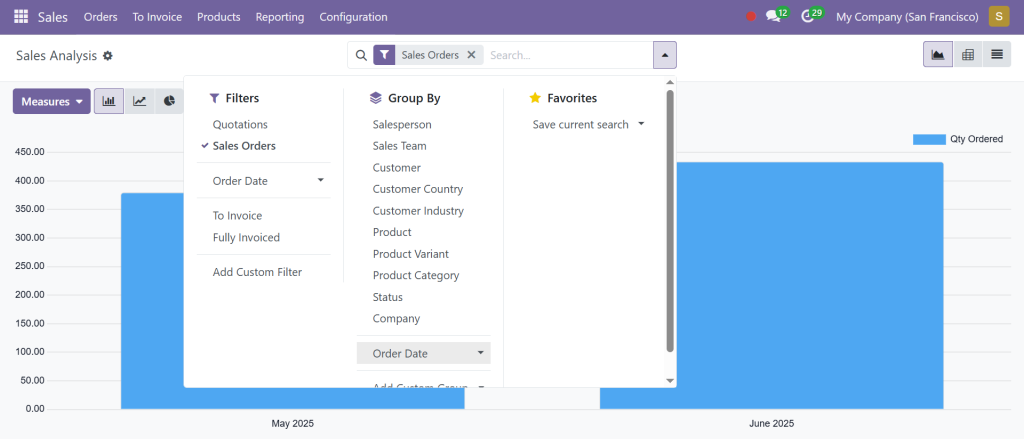
Step 3: Use the Pivot Table View
Switch to Pivot view for dynamic analysis. You can:
- Drag fields to columns/rows
- Add measures like Total Revenue, Quantity Sold
- Export data to Excel for offline use
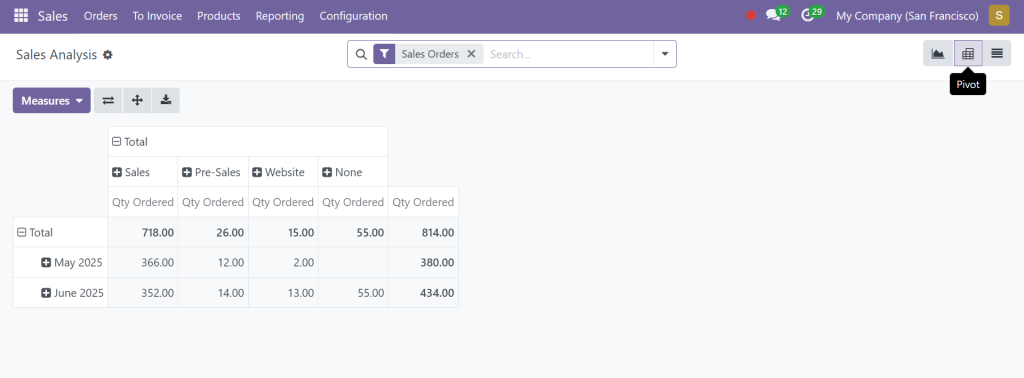
Step 4: Use Filters and Group by Options
Use the top-bar filters for:
- Customer
- Product
- Order Status
- Date Range
Use “Group by” to analyze data by:
- Month
- Salesperson
- Country
Step 5: Exporting the Sales Report
Click the Export icon to generate:
- XLSX
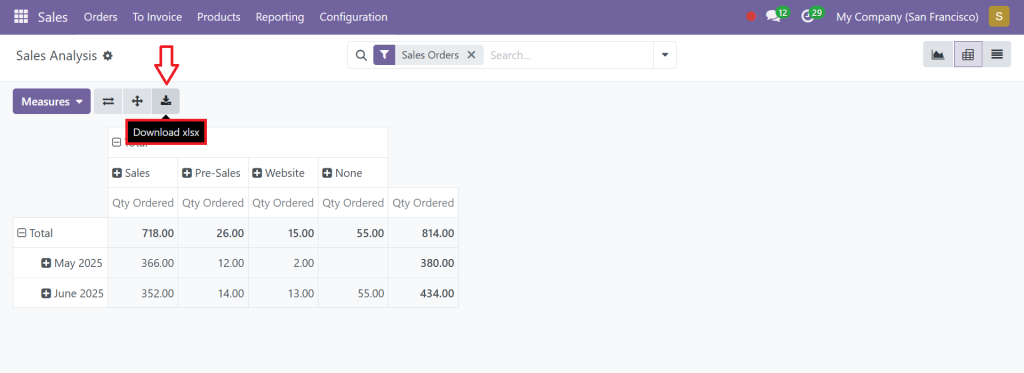
By following this Odoo 18 sales report tutorial, you can generate detailed sales data to support strategic decisions.
How to Generate Purchase Reports in Odoo 18
Let’s now cover the Odoo 18 purchase report guide with actionable steps:
Step 1: Install and Activate the Purchase Module
Direct to:
Apps > Search “Purchase”> Install
Step 2: Go to Purchase Reporting
Visit:
Purchases > Reporting > Purchase
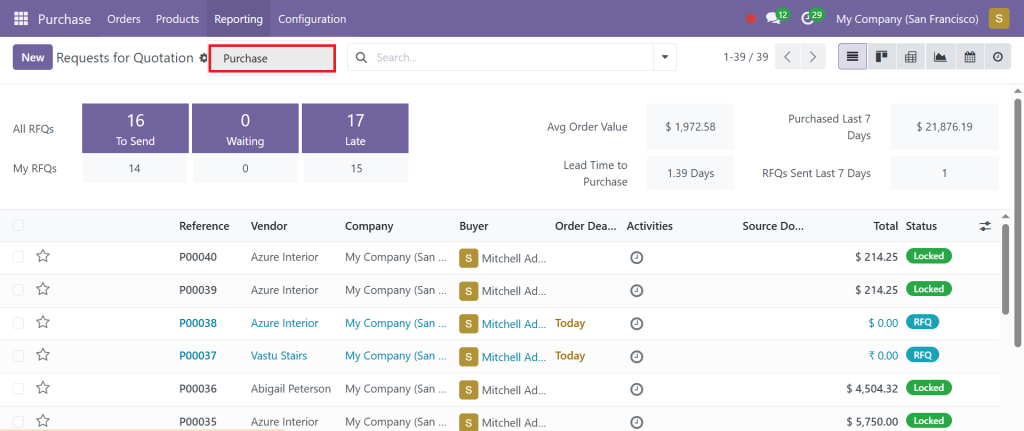
Here, you’ll see aggregated data including:
- Vendor
- Purchase Amount
- Product Category
- Delivery Delays
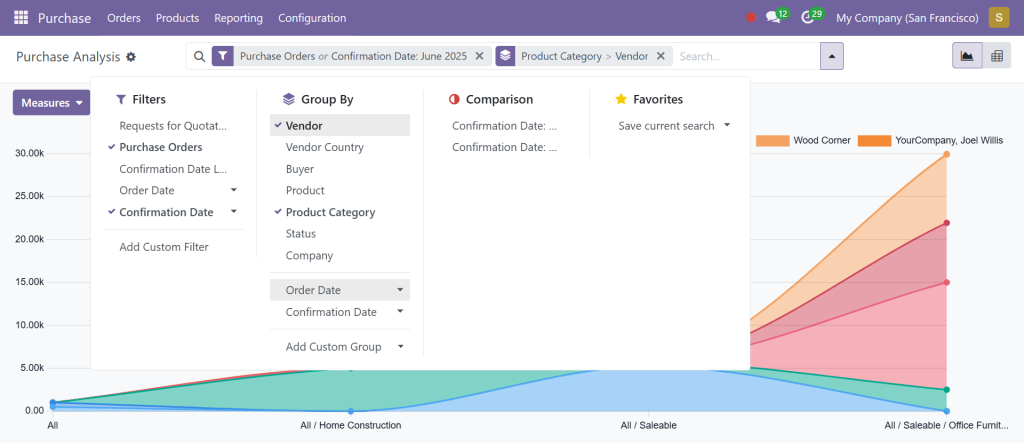
Step 3: Dive into the Pivot Table
In the Pivot view, analyze:
- Vendor spend analysis
- Most purchased products
- Quantity vs cost trends
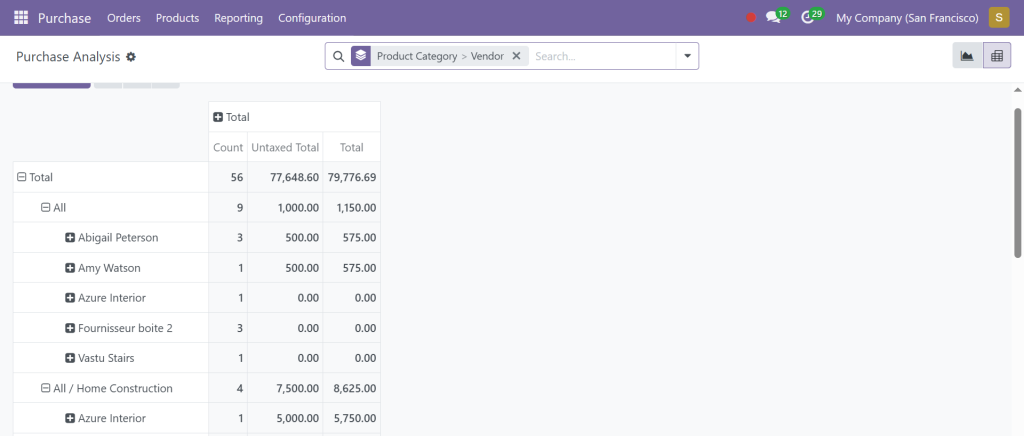
Step 4: Use Group by and Filters
Group by:
- Vendor
- Product
- Purchase Representative
- Date
Use Filters to narrow down based on the following:
- Order Status
- Delivery status
- Date ranges
Step 5: Export and Present Reports
Export the filtered view to Excel or PDF. Share with procurement teams or use in supplier negotiations.
The purchase analysis in Odoo 18 helps businesses control costs, spot inefficiencies, and improve vendor relationships.
Why Businesses Are Falling in Love with Purchase Analysis in Odoo 18
You’ll quickly find that the ability to perform purchase analysis in Odoo 18 goes far beyond operational benefits. It becomes a tool for strategic transformation. Innovative procurement isn’t just about buying at the lowest cost. It’s about buying the right products from the right vendors at the right time. By comparing purchase frequency, vendor pricing, lead times, and delivery accuracy within the same interface, businesses start to move from reactive to proactive.
This insight gives purchasing teams a new level of confidence and control. You can pivot your procurement strategy based on actual data, not hunches. And when combined with real-time sales data, the decision-making matrix becomes incredibly rich. You’re not operating in silos anymore. Your purchase data and sales data are speaking to each other. That’s the magic of sales and purchase reports in the Odoo 18 Community.
Odoo 18 Sales and Purchase Reports – The Unseen Power Tool
At first glance, reporting is the least exciting feature in an ERP system. But dive into the sales and purchase reporting in Odoo 18, and you’ll discover that it’s the engine room of strategic planning. It’s where your business gets to see its heartbeat, where data confirms intuition and is translated into action. From a simple Odoo 18 sales report tutorial to an advanced Odoo 18 purchase report guide, this system offers something for everyone, whether a data geek or a business operator.
So, if you’re using the Odoo 18 Community version, don’t underestimate what’s already in your hands. Use the filters, dive into the graphs, play with the pivot tables, and customize when needed.
But most importantly, make it a habit. Let data guide your decisions, and let insights shape your strategies. In business, those who learn reporting move faster, act smarter, and grow stronger.
It all begins with a simple question: How can I generate sales and purchase reports in the Odoo 18 Community?
Now you know, and the honest exploration begins.
For deeper integrations, custom modules, or implementation support, Netilligence is here to help you get the most out of Odoo. Let us know how we can boost your ERP journey!