
Make Better Decisions with an Odoo Pivot Table
An Odoo pivot table gives businesses a simple way to turn large amounts of business information into useful insights. Instead of going through hundreds or thousands of sales, invoices, products, or customer records, you can organize the information into a clear summary and quickly see what matters.
With Odoo Spreadsheet, this analysis becomes even more useful. You can bring an Odoo pivot table from an existing Odoo pivot view into a spreadsheet, combine it with other information, add formulas, and create a customized report. You can then use the same spreadsheet to build an Odoo dashboard that gives your team a visual overview of important business numbers.
This is where Odoo reporting becomes much more practical. Rather than checking separate reports across different applications, your team can bring relevant information together and use Odoo data analysis to identify trends, compare performance, and make informed decisions.
An Odoo pivot table can be particularly useful for sales managers, finance teams, inventory managers, HR departments, and business owners. Whether you want to compare sales by salesperson, review revenue by month, analyze product performance, or monitor operational figures, the Odoo pivot table provides a structured starting point.
The best part is that Odoo connects inserted data to the underlying database, allowing information to be refreshed as the database changes.
What Is an Odoo Pivot Table and Why Does It Matter?
An Odoo pivot table is a reporting tool that helps you organize and summarize large datasets using dimensions and measures.
For example, imagine you want to understand your sales performance. You could organize:
- Salesperson as a row
- Month or quarter as a column
- Total sales amount as the measure
Instead of reading individual sales orders, you get a summarized view of sales performance.
This makes an Odoo pivot view useful when you need to look at the same data from different angles. You can group information, change measures, sort results, and compare different dimensions.
Odoo’s documentation explains that pivot tables can summarize data without requiring complicated formulas. They can also be inserted into Odoo Spreadsheet, Odoo dashboards, or other supported spreadsheet environments.
For a growing business, this can save time. Your team spends less time collecting numbers manually and more time understanding what those numbers mean.
How to Insert an Odoo Pivot Table into an Odoo Spreadsheet
One of the easiest ways to use an Odoo pivot table is to start from an existing pivot report in Odoo.
Step 1: Open the Relevant Pivot View
First, open the Odoo application containing the report you want to analyze.
For example, you might open a sales analysis report
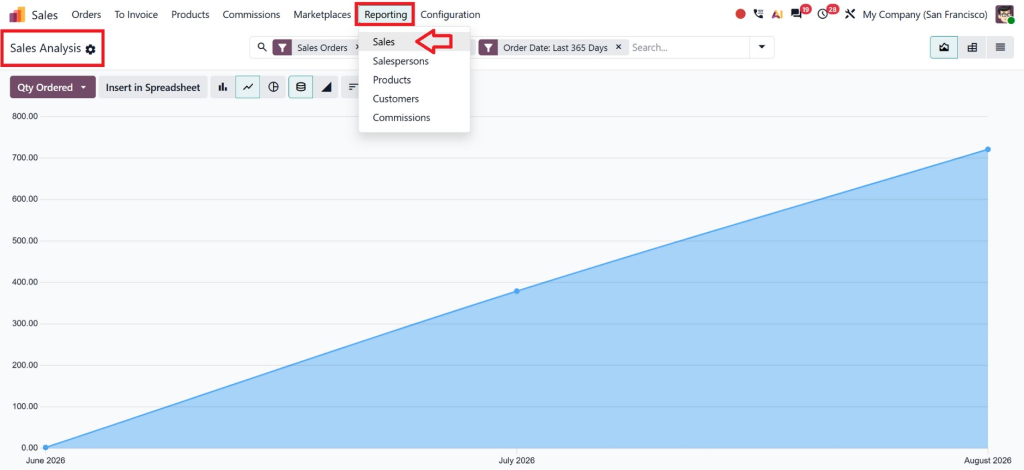
and switch to the Odoo pivot view.
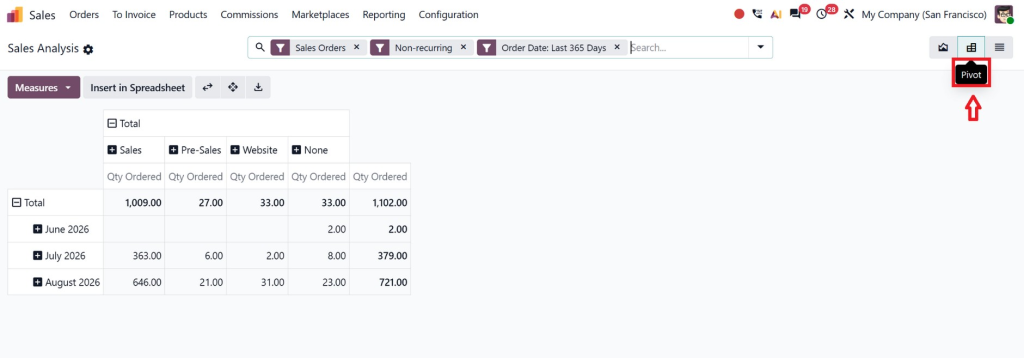
Before inserting it into the spreadsheet, adjust the report according to your requirements. You can apply filters, select relevant measures, and group information based on the business question you want to answer.
For example, a sales manager might want to see:
- Sales by salesperson
- Sales by product
- Sales by month
- Sales by sales team
- Total invoiced amount
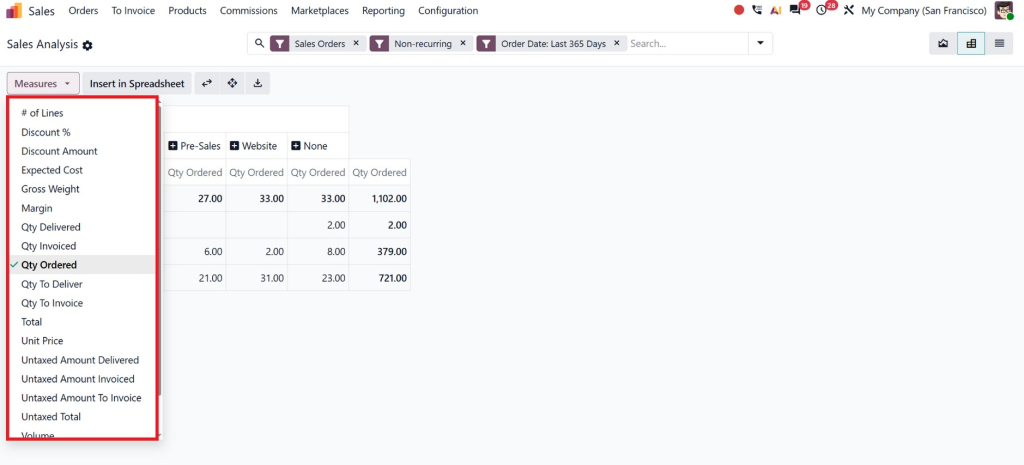
Preparing the pivot view first helps ensure that the spreadsheet contains useful information rather than unnecessary data.
Step 2: Click “Insert in Spreadsheet”
Once the pivot view is ready, click Insert in Spreadsheet at the top of the view.
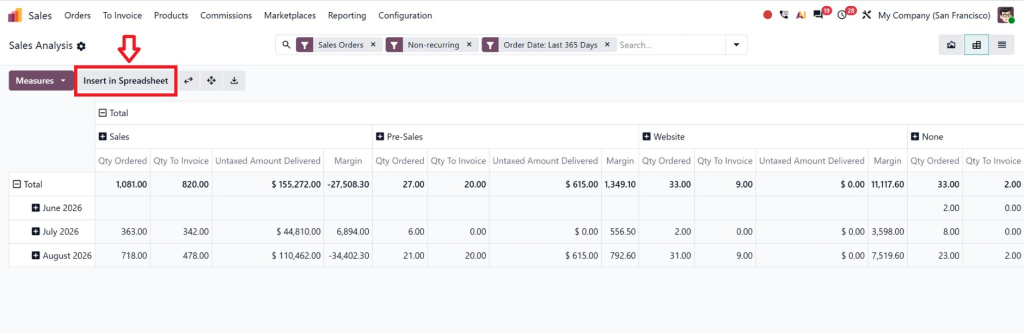
Odoo then opens a window where you can name the pivot table and select where it should be inserted. You can choose an existing spreadsheet or create a new blank spreadsheet.
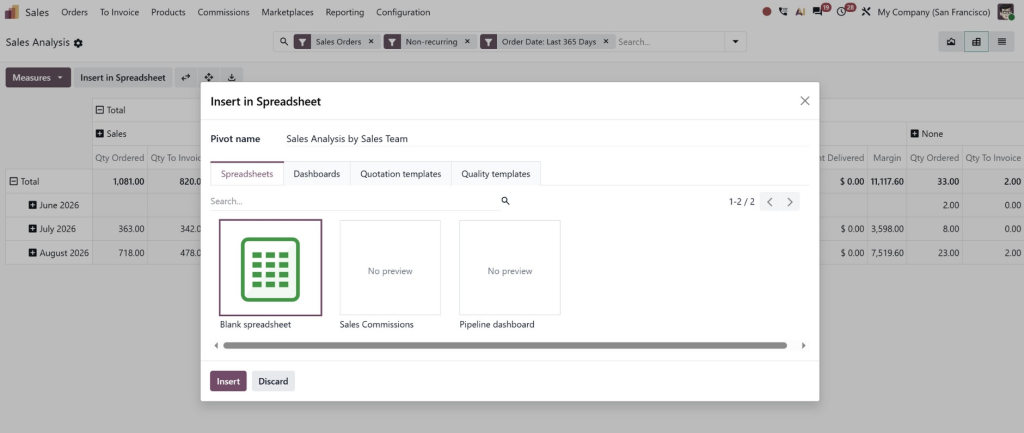
Step 3: Choose or Create Your Spreadsheet
If you select Blank spreadsheet, Odoo creates a new spreadsheet for the data.
If you already have an Odoo Spreadsheet prepared for reporting, you can select that spreadsheet instead.
After confirming, the pivot table is inserted into a new sheet within the spreadsheet.
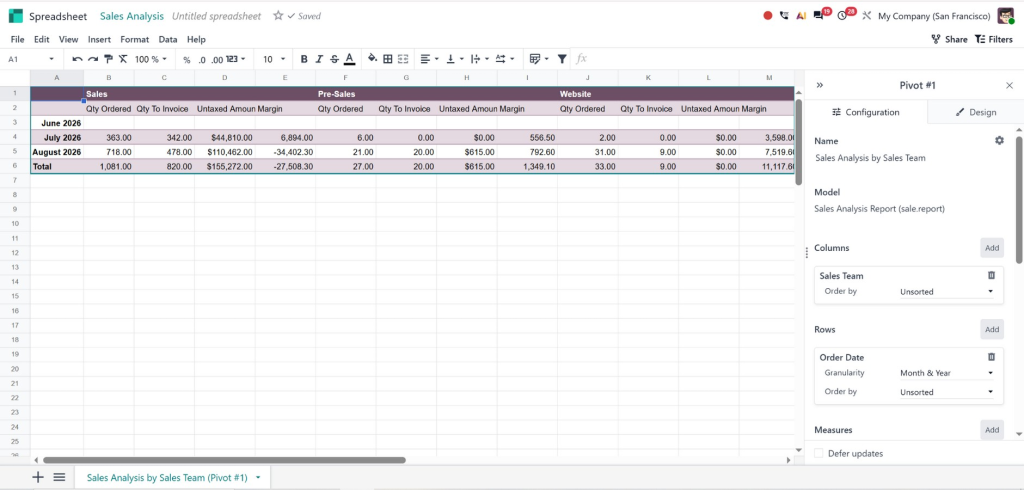
This gives you a much more flexible environment for further analysis.
How to Create a Pivot Table Directly from Odoo Spreadsheet
You do not always have to start from an existing Odoo pivot view.
Odoo also allows users to create a pivot table directly from Odoo data within a spreadsheet. This can be useful when you need information from a model that does not already have a dedicated pivot view.
To do this:
- Open the relevant Odoo Spreadsheet.
- Go to Insert from the spreadsheet menu.
- Select Pivot table From Odoo data.
- Choose the required Odoo model.
- Click Save.
- Configure the dimensions and measures of the pivot table.
Odoo creates a new sheet containing the pivot table, along with a properties panel where you can configure it.
This approach is particularly useful for customized Odoo data analysis because you can work with data directly from the Odoo database instead of manually copying information into a spreadsheet.
You can also create a pivot table from a range of data already available in the spreadsheet. This could be manually entered information or Odoo data that has already been inserted from another view.
Static vs. Dynamic Odoo Pivot Table: What Is the Difference?
When you insert an Odoo pivot table from an Odoo pivot view, it is initially a static pivot table.
The data remains connected to the Odoo database and can be updated, but the pivot table’s dimensions and measures cannot be freely manipulated in the same way as a dynamic pivot table.
You can convert it into a dynamic pivot table when you need more flexibility.
A dynamic pivot table is useful when you want to change dimensions, measures, or the way information is analyzed directly within the spreadsheet. Odoo also supports pivot tables that retrieve data directly from Odoo using an Odoo-specific array function.
For example, a management team might initially want to see sales by salesperson. Later, they may want to compare the same information by product category or sales region.
A dynamic setup gives your team more freedom to manipulate the analysis without rebuilding the report from scratch.
This is one reason why combining an Odoo pivot table with Odoo Spreadsheet can be valuable for businesses that regularly need customized reporting.
How to Add an Odoo Pivot Table to an Odoo Dashboard
Once your spreadsheet contains the information you need, you can take your reporting one step further by creating an Odoo dashboard.
In Odoo 19, spreadsheets are used as the foundation for custom dashboards. You can insert Odoo data into a spreadsheet and then convert that spreadsheet into a dashboard.
Method 1: Insert the Pivot Table Directly into a Dashboard
You can insert a pivot table into an existing dashboard from the relevant pivot view.
Open the required pivot view and click Insert in Spreadsheet. In the window that appears, select the Dashboards tab and choose the dashboard where you want the pivot table to appear.
Odoo then opens the dashboard’s underlying spreadsheet and inserts the pivot table into a new sheet.
This is useful when your dashboard already exists and you simply want to add another reporting component.
Method 2: Convert an Odoo Spreadsheet into a Dashboard
You can also build the spreadsheet first and convert it into an Odoo dashboard.
After preparing your spreadsheet, go to:
File → Add to dashboard
Enter the dashboard name, select an existing dashboard section or create a new one, and configure the appropriate access groups.
Odoo uses the first spreadsheet tab as the front end of the dashboard. Once the spreadsheet is converted, further modifications are made through the Dashboards application.
This approach is ideal when you want to build a more complete Odoo spreadsheet dashboard with multiple reports, KPIs, charts, formulas, and pivot tables.
Build a More Useful Odoo Spreadsheet Dashboard
Simply adding an Odoo pivot table to a spreadsheet is only the beginning. The real value comes from turning your information into a dashboard that your team can understand quickly.
For example, a sales dashboard could include:
- Total sales
- Monthly revenue
- Sales by salesperson
- Top-performing products
- Sales by customer
- Sales pipeline information
- Sales trends through charts
You can combine pivot tables, charts, lists, formulas, and other Odoo data sources in the same spreadsheet. Odoo allows lists, pivot tables, and charts from different applications and models to be inserted into one spreadsheet, with data sources connecting them to the underlying database.
This creates a central location for Odoo reporting.
You can also use filters to make the dashboard more interactive. For example, management might want to select a particular sales team, period, or company and instantly review the relevant numbers.
When designing an Odoo spreadsheet dashboard, focus on the information people actually need. Too many charts and tables can make a dashboard difficult to understand. A clean layout with a few important KPIs and supporting reports is usually much more effective.
Why Businesses Should Use Odoo Pivot Tables for Data Analysis
Businesses generate a huge amount of information every day. Sales orders, invoices, customer records, inventory movements, employee information, and purchasing data can quickly become difficult to manage.
An Odoo pivot table helps transform this information into structured reports.
Faster Reporting
Instead of manually exporting information and creating summaries, teams can use Odoo’s reporting tools to organize data more efficiently.
Better Data Analysis
With Odoo data analysis, managers can identify patterns that may not be obvious when looking at individual records.
Less Manual Work
Because Odoo data sources connect the spreadsheet to the database, users do not necessarily have to rebuild reports every time the underlying data changes. Data can also be refreshed manually through the spreadsheet’s data menu.
One Place for Business Insights
An Odoo dashboard can bring multiple reports together, allowing decision-makers to view important information without moving between several applications.
More Flexible Reporting
With Odoo Spreadsheet, businesses can go beyond standard reports by combining Odoo data with calculations, custom metrics, charts, and other spreadsheet elements.
Turn Odoo Reporting Into Actionable Business Insights with Netilligence
Setting up an Odoo pivot table may look simple, but building reporting that actually supports business decisions requires a clear understanding of your workflows, data, and reporting requirements.
This is where the right Odoo implementation partner can make a real difference.
At Netilligence, we help businesses get more value from Odoo by configuring solutions around their actual business processes. Whether you need customized Odoo reporting, an Odoo spreadsheet dashboard, better data visibility, or help connecting different Odoo applications, our team can help you build a setup that works for your business.
Instead of relying on disconnected spreadsheets and manually prepared reports, you can bring your business information together in Odoo and create reporting that is easier to access, understand, and act on.
From configuring your Odoo pivot table to designing dashboards and improving your overall reporting workflow, the goal is simple: give your team clearer information so they can make better decisions.
If your business is already using Odoo but still depends heavily on manual reporting, it may be time to rethink your approach. With the right configuration, Odoo Spreadsheet and Odoo dashboards can turn everyday business data into practical insights that support smarter decisions and more efficient operations.