Let me ask you something: how many times have you struggled with messy spreadsheets, outdated reports, or dashboards that never seem to tell the whole story? I’ve been there, and I know how frustrating it can be. This is exactly why Odoo Spreadsheet Basics is such a game-changer.
Simply put, Odoo spreadsheets and dashboards bring all your business data together in one place. You can connect sales numbers, inventory updates, and financial reports in real time and turn that raw data into meaningful insights. Today, I’m going to walk you through how to use Odoo spreadsheets and dashboards in a way that feels easy and natural, but also powerful enough to make your business smarter.
By the end of this guide, you’ll know how to:
Create professional spreadsheets in Odoo 19.
Integrate live data for instant insights.
Build pivot tables and charts that actually tell stories.
Turn your spreadsheets into fully interactive dashboards.
Yes, all of this is possible, and trust me, it’s easier than you think!
What Makes Odoo Spreadsheet Basics So Powerful?
Before we get into the step-by-step tutorial, let’s talk about why Odoo Spreadsheet Basics is more than just “another spreadsheet tool.”
Real-Time Data Integration – Imagine your sales numbers, inventory, and accounting reports all updating automatically, and no more exporting CSV files or copying data manually. With Odoo, your spreadsheets are always live.
Interactive Dashboards – Don’t just crunch numbers, see them. Odoo lets you build dashboards with charts, pivot tables, and KPIs that actually make sense.
Collaboration Without Chaos – Multiple team members can work on the same spreadsheet simultaneously. Everyone stays on the same page, literally.
Automation That Saves Time – From recurring calculations to automated reports, Odoo takes care of the repetitive work so you can focus on decision-making.
Scalability – Whether you’re a small business or a large enterprise, Odoo scales with your data needs.
The beauty of Odoo BI spreadsheet and dashboard features is that it combines all these capabilities into one platform. You’re not juggling multiple apps or tools, everything is centralized and connected.
Getting Started with Odoo Spreadsheet Basics
Alright, let’s roll up our sleeves and see how you can start using the Odoo 19 spreadsheet dashboard tutorial in your business. Don’t worry, I’ll keep it simple and practical.
Step 1 – Create Your First Spreadsheet
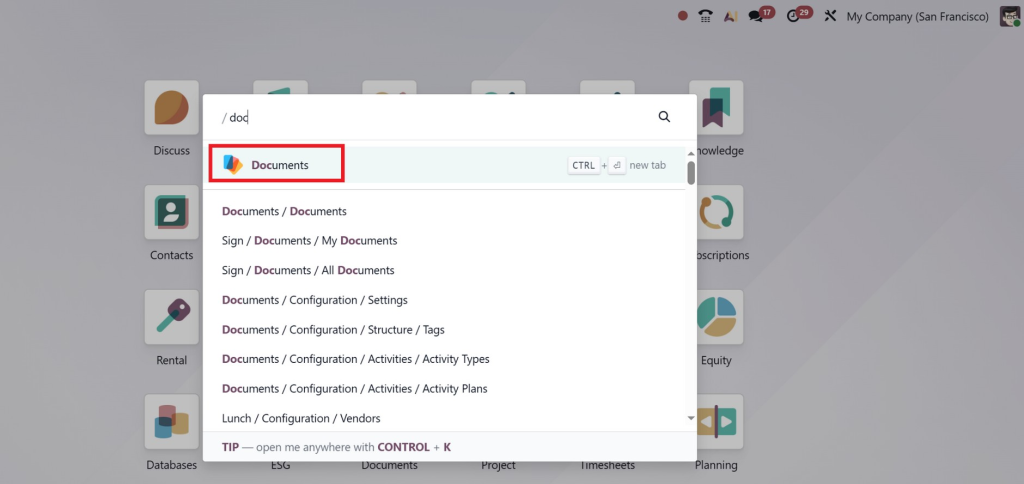
Log in to your Odoo 19 account.
Go to the Documents module (the Spreadsheet feature is accessed from here, not directly).
Inside Documents, you will see an option for Spreadsheets.
Think of this as your digital notebook, but smarter. Everything you put in here can be connected to other Odoo modules.
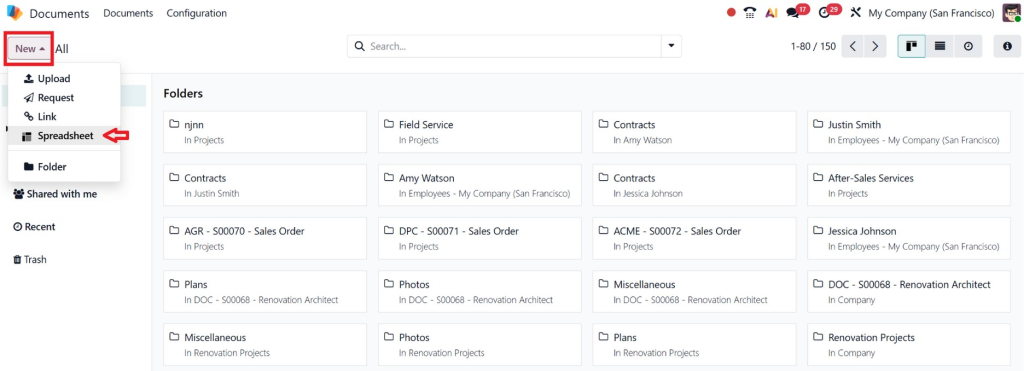
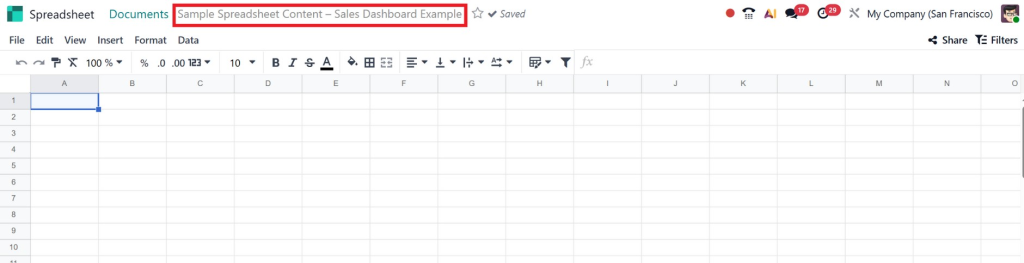
Step 2 – Create a New Spreadsheet
Click New > Spreadsheet.
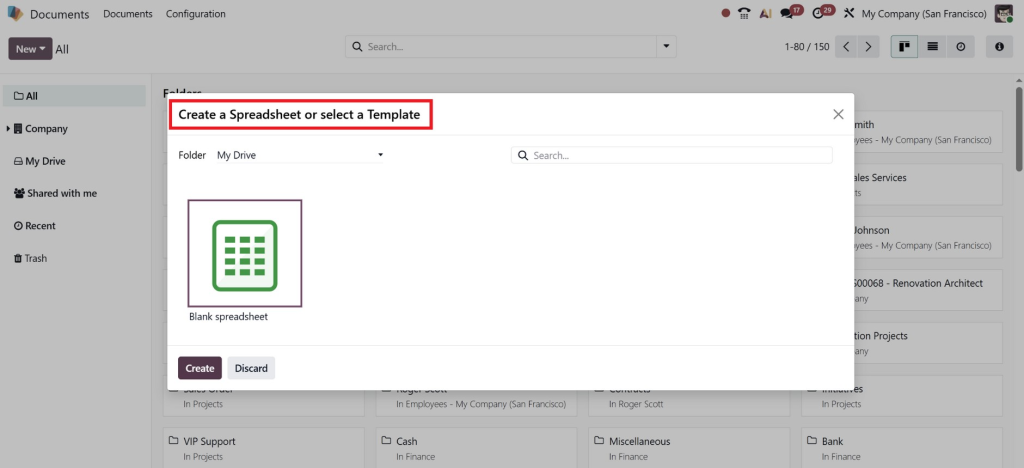
You can choose between a Blank Spreadsheet or a Template.
Give your spreadsheet a name and open it.
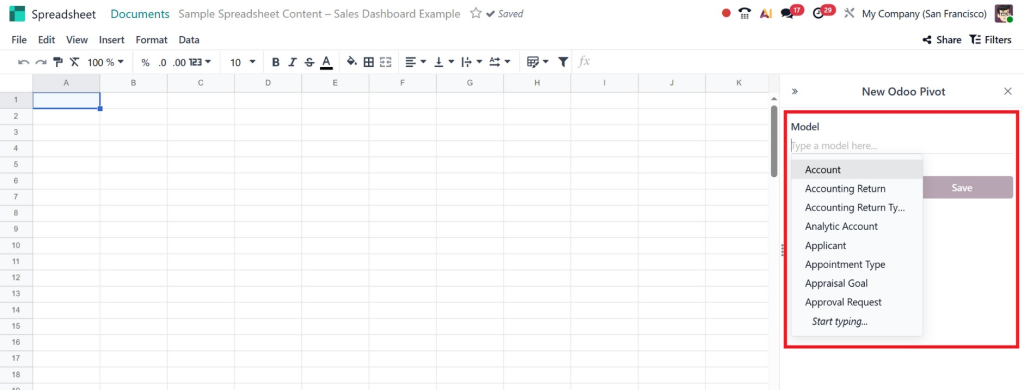
Step 3 – Adding Real-Time Data
Inside the spreadsheet, click Insert > Link to Odoo Data.
Select the module you want to connect (e.g., Sales, Inventory, Accounting, HR).
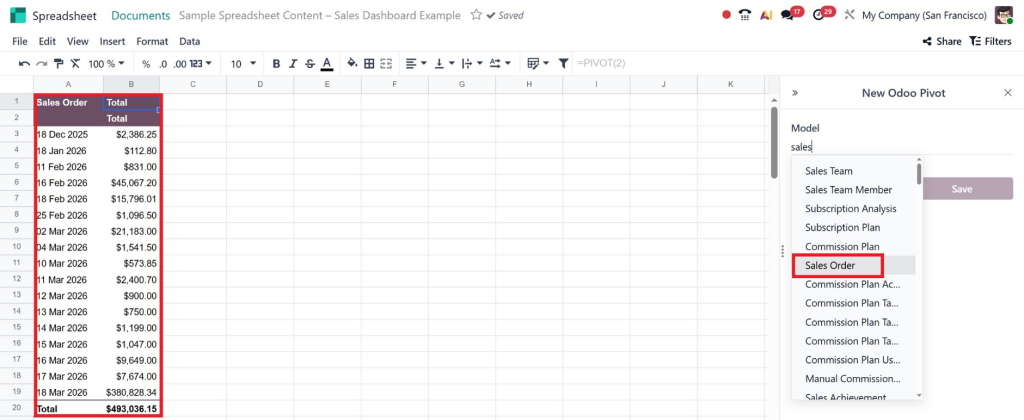
Choose the records you want to pull. The spreadsheet will now update automatically whenever the source data changes, giving you real-time insights.
Step 4 – Organize Your Data
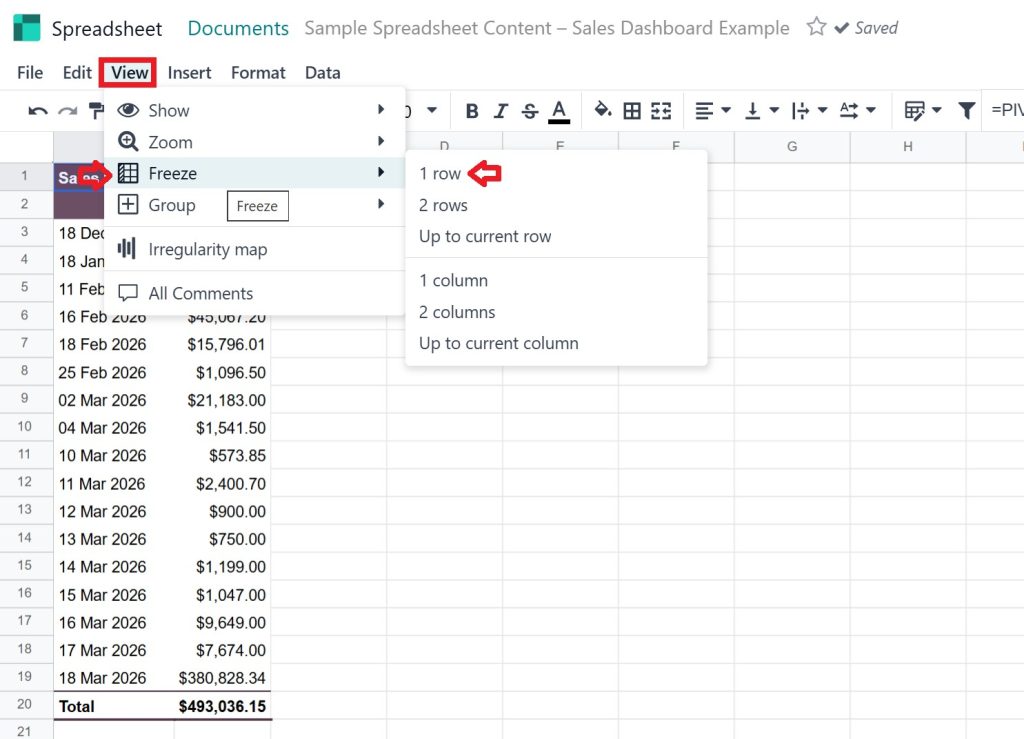
Freeze the top row for headers.
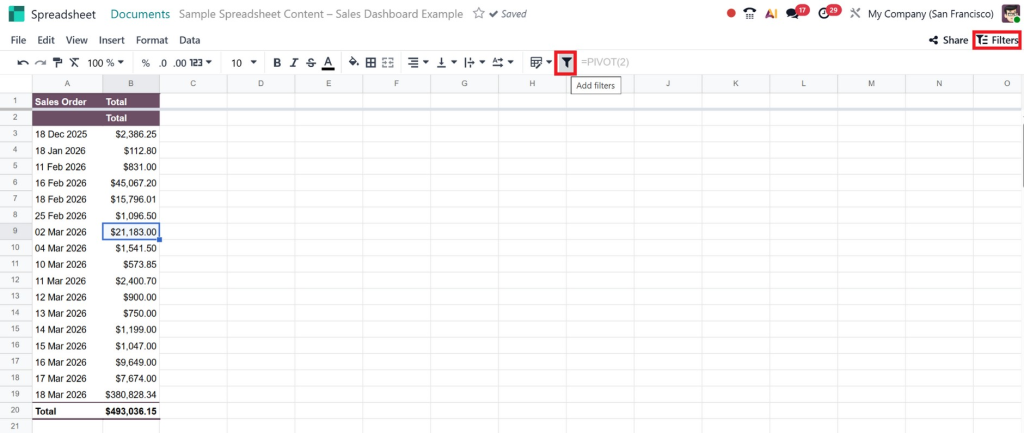
Apply sorting and filters to make the data easy to read.
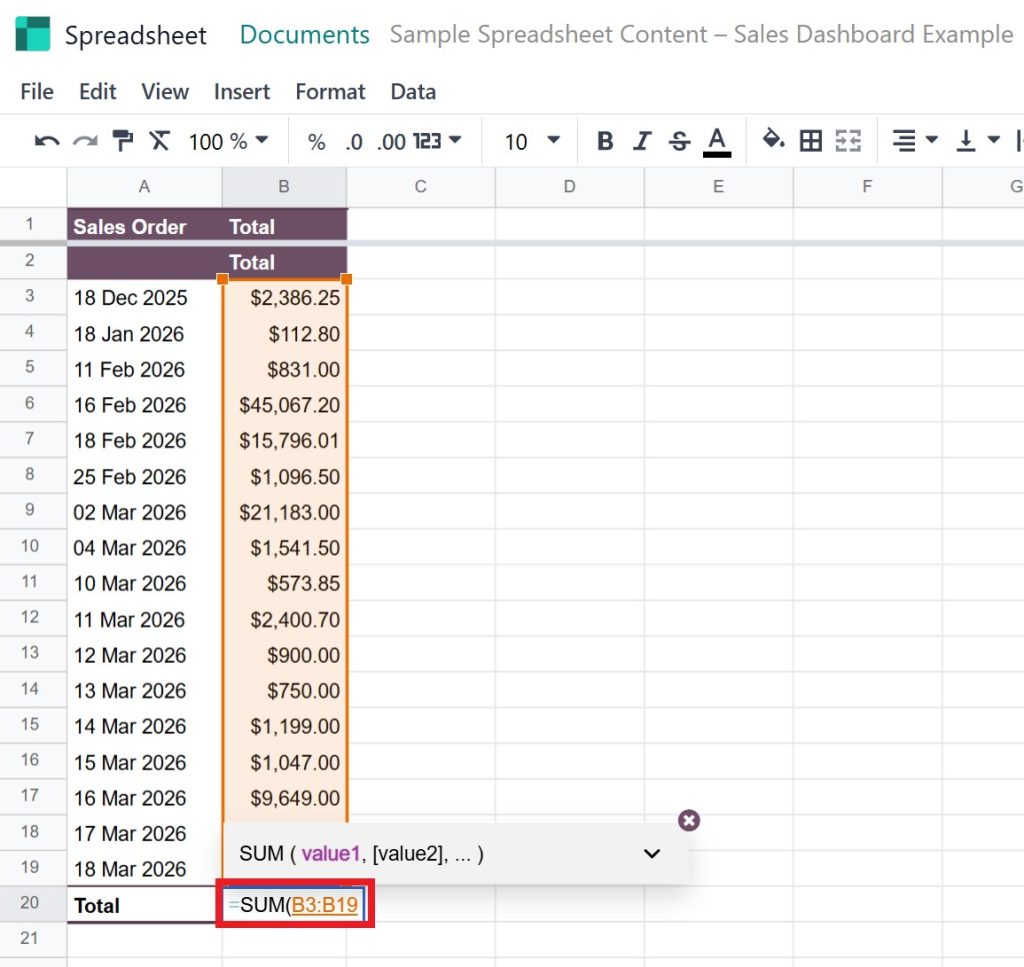
Use formulas like SUM, AVERAGE, IF, or custom formulas for calculations.
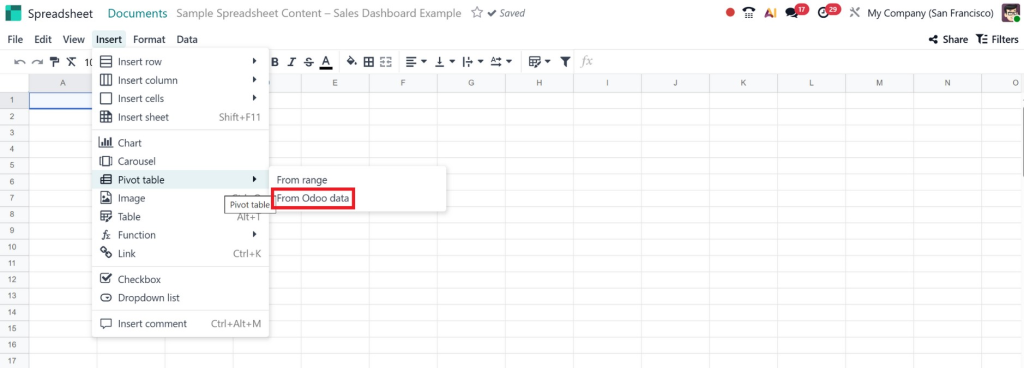
Step 5 – Create Pivot Tables and Charts
Highlight the data range you want to analyze.
Click Insert > Pivot Table to summarize the data.
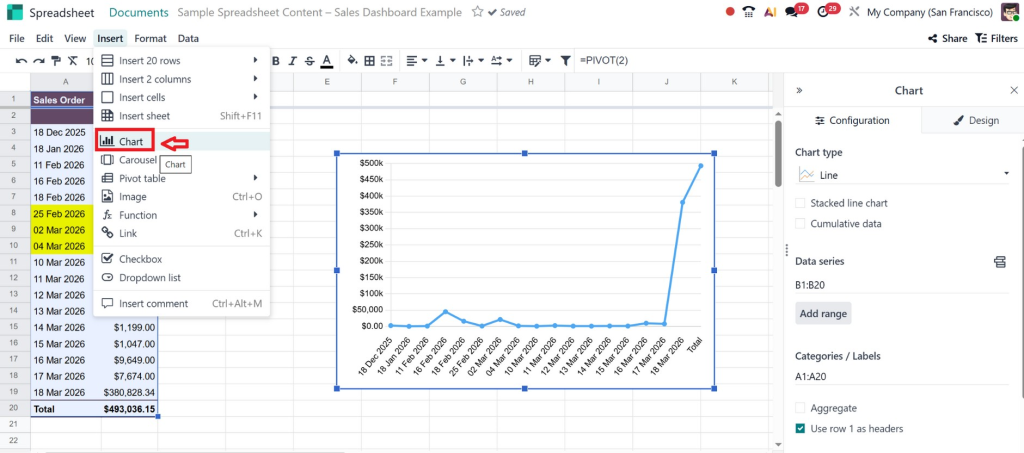
For visual insights, click Insert > Chart and choose from bar, line, pie, or combo charts.
Customize rows, columns, measures, colors, and labels to make the insights clear.
Understanding Pivot Tables and Charts in Odoo
Now that you have your data, it’s time to turn it into insights. That’s where pivot tables and charts come in.
Pivot Tables – Summarize Like a Pro
Pivot tables are like magic; they summarize tons of data in a few clicks. Here’s how to do it in Odoo:
Highlight your dataset.
Go to Insert > Pivot Table.
Drag fields into rows, columns, and measures (like total sales, quantity, or profit).
Pivot tables are perfect if you want to answer questions like:
Which product sold the most this month?
Which region is performing the best?
How is my revenue trending week by week?
With Odoo spreadsheet pivot tables and charts, you can see patterns in your data that would otherwise remain hidden.
Charts – Make Your Data Speak
Numbers are great, but visuals are better. Odoo lets you create a variety of charts:
Select your data range.
Click Insert > Chart.
Choose bar, line, pie, or combo charts. Customize colors, labels, and layouts to make them clear.
Charts make your dashboards engaging and understandable. Even someone who isn’t a data expert can glance at your dashboard and immediately know what’s going on.
How to Build Dashboards from Odoo Spreadsheets
Here’s where things get exciting. Dashboards are the ultimate tool for business insights, and creating dashboards from Odoo spreadsheets is easier than you think.
Step 1 – Plan Your Dashboard
Before you start building, think about the purpose of your dashboard. Ask yourself:
Who is going to use it?
What KPIs are important?
Do I need daily updates, weekly summaries, or monthly reports?
Common dashboards include:
Sales performance
Financial analysis
Inventory management
Employee productivity
Step 2 – Build the Components
Start with pivot tables for detailed data summaries.
Add charts for quick visual insights.
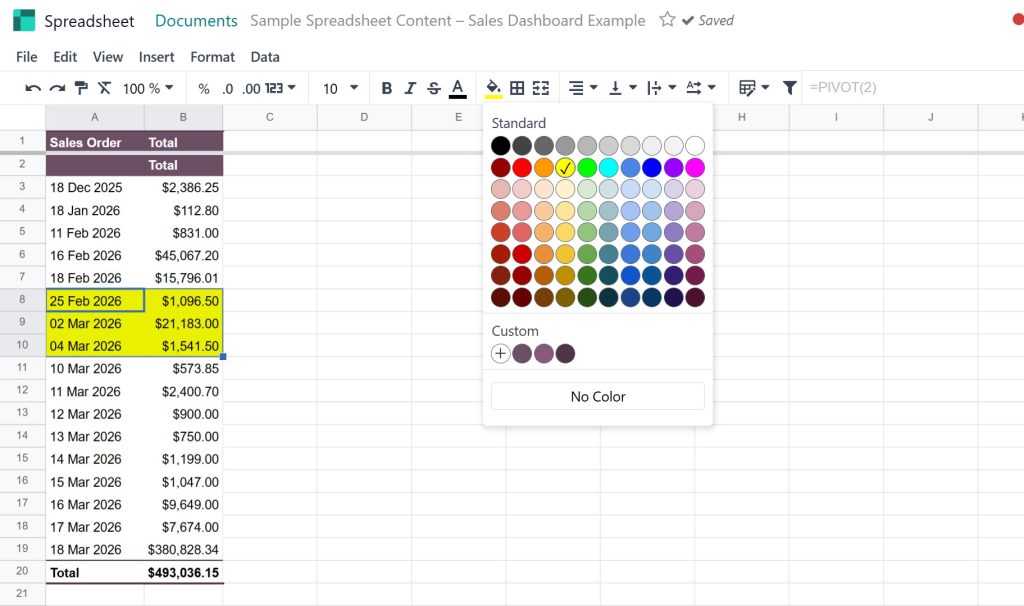
Use color coding and conditional formatting to highlight trends and anomalies.
Step 3 – Assemble the Dashboard
Click Insert > Dashboard.
Drag and drop your pivot tables, charts, and key metrics into place.
Resize and adjust layouts for clarity.
The goal is to create a dashboard that tells a story at a glance. With Odoo BI spreadsheet and dashboard, you can create interactive dashboards that update in real-time, giving your team instant access to the insights they need.
Advanced Tips for Power Users
Once you’re comfortable with the basics, here are some advanced tricks to take your Odoo spreadsheets to the next level:
Conditional Formatting – Automatically highlight cells based on thresholds, like overdue invoices or low stock.
Custom Formulas – Use SUMIF, VLOOKUP, and nested IF statements to create dynamic calculations.
Collaboration – Share spreadsheets with your team, set permissions, and collaborate in real-time.
Automated Reports – Schedule reports to be emailed directly to stakeholders.
Interactive Filters – Add dropdowns or slicers to let users interact with your dashboard dynamically.
These tips help you not just manage data, but also analyze and act on it faster.
Real-Life Benefits of Using Odoo Spreadsheet Basics
You might be wondering: “Okay, this sounds good, but how does it actually help me?” Let’s break it down.
Save Time – No more copying data between modules or updating static reports.
Increase Accuracy – Real-time data reduces mistakes and ensures everyone works from the same numbers.
Better Decisions – Interactive dashboards provide instant insights so that you can make faster, smarter decisions.
Team Collaboration – Everyone sees the same data, in the same format, in real-time.
Scalable Insights – As your business grows, your Odoo spreadsheets grow with it.
Businesses that adopt the Odoo 19 spreadsheet dashboard tutorial see measurable improvements in efficiency, accuracy, and decision-making.
Conclusion – Take Action Today
If you’ve read this far, you now know that Odoo Spreadsheet Basics is more than just a tool, they’re a complete business solution. From real-time data integration to pivot tables, charts, and dashboards, Odoo makes your data actionable and understandable.
Here’s what you should do next:
Start small. Create one spreadsheet with real-time data.
Experiment with pivot tables and charts.
Build a dashboard for a single department or KPI.
Expand to more dashboards and deeper insights as you get comfortable.
Remember, learning how to use Odoo spreadsheets and dashboards isn’t just about understanding software, it’s about transforming the way your business works.
At Netilligence, we specialize in helping businesses implement Odoo 19, customize dashboards, and train teams so they can get the most out of every feature. Don’t wait, empower your business with actionable insights today.
Hi, I'm Nabia, an Odoo ERP functional & technical content writer. I specialize in blogs, social media content, ad copy, landing pages, service pages, and email campaigns.
We use cookies to ensure that we give you the best experience on our website. If you continue to use this site we will assume that you are happy with it.