The financial performance analysis of events stands as a vital requirement for event management professionals in today’s dynamic world. Odoo 18 provides powerful tools which enable you to analyze the financial revenues produced by your events. The Odoo 18 Events Revenue Report delivers comprehensive financial data about ticket sales and attendee statistics and event financial performance. This tutorial provides step-by-step instructions to help you maximize the potential of the Odoo 18 Events Revenue Report.
Step-by-Step Process to Access & Customize Revenues Report in Odoo 18
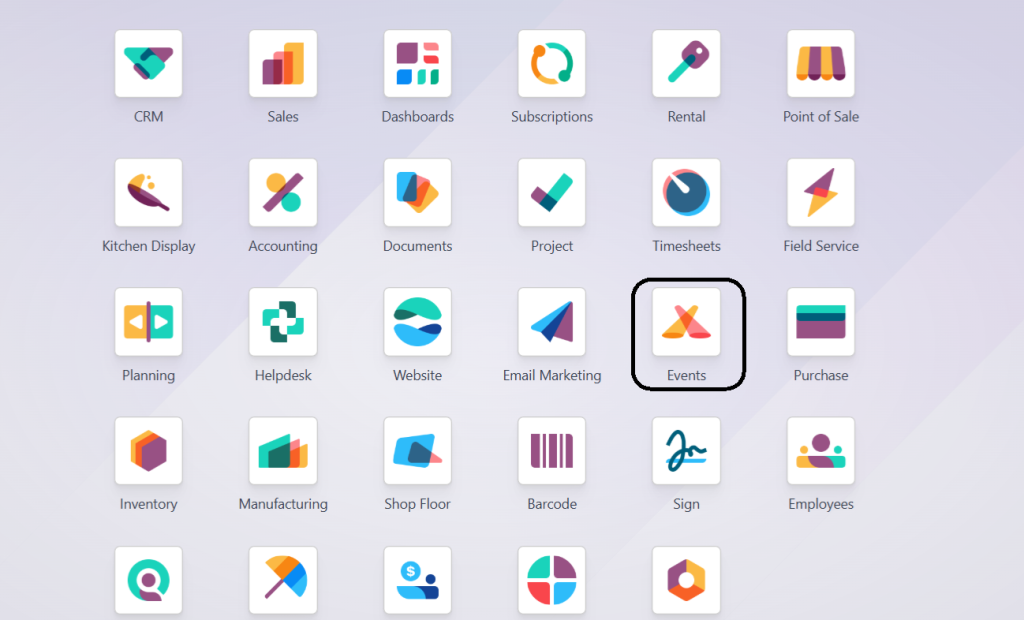
1. Navigate to the Events Module
Go to the Events module from your Odoo 18 dashboard.
2. Access the Reporting Section
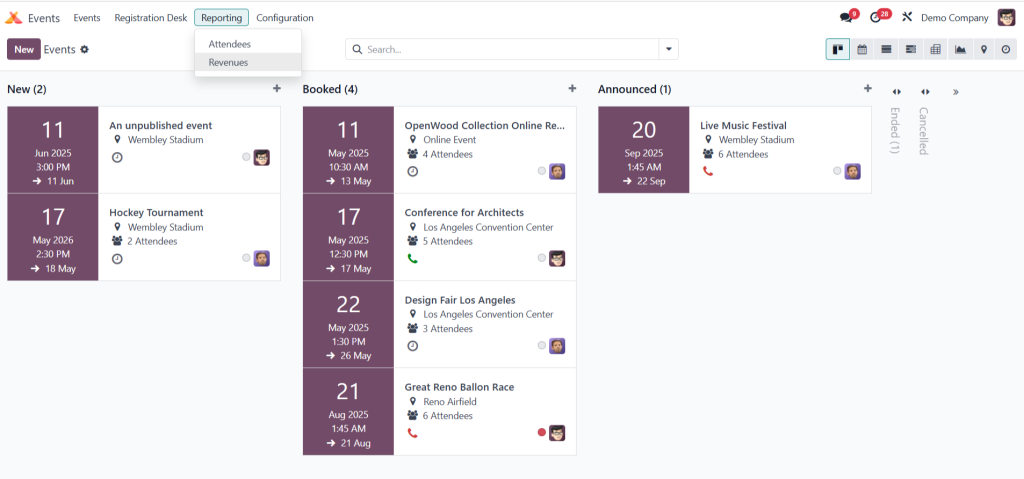
- Inside the Events module, look for the “Reporting” section on the sidebar.
- Click on “Revenues” under the Reporting menu.
3. Understand the Default View
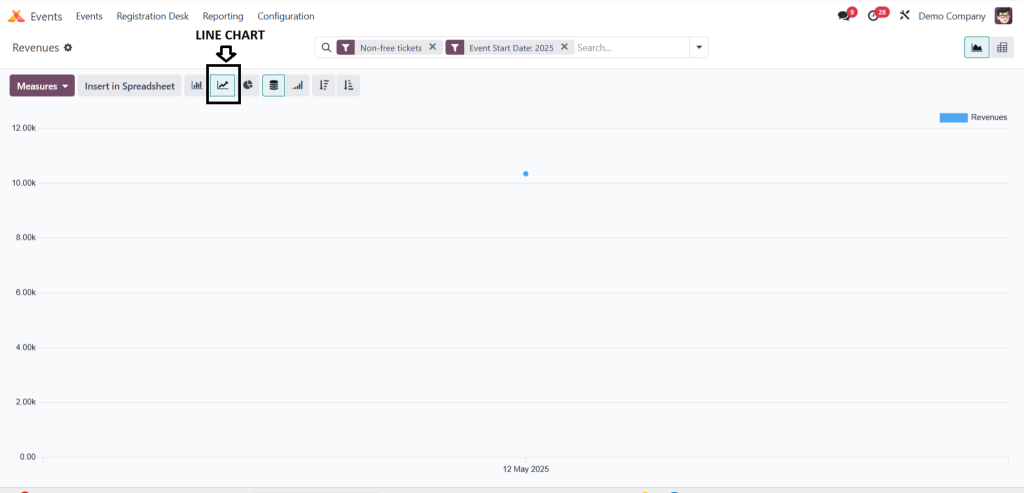
- The default view is a line chart.
- It shows revenue data for non-free tickets of the current year.
4. Switch to Pivot Table
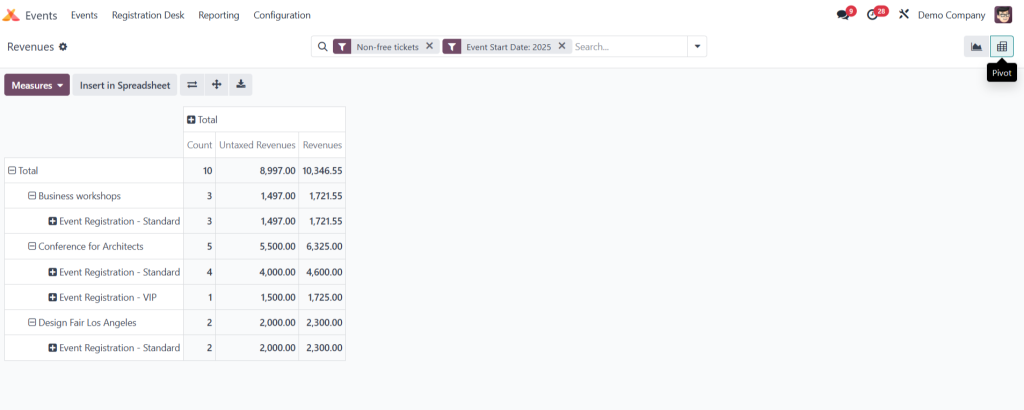
- Use the icon on the top right to switch from line chart to Pivot Table view.
- This view supports more detailed analysis.
5. Customize Measures
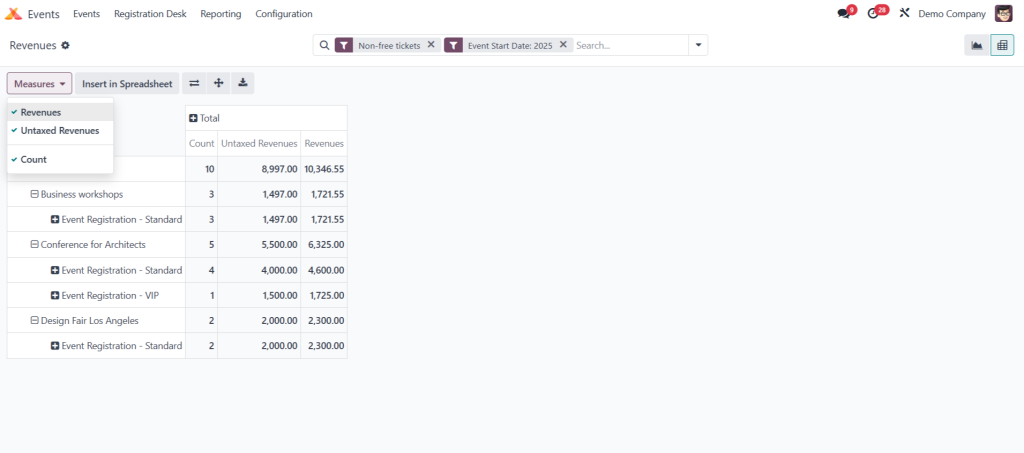
- In Pivot Table, you can select multiple measures:
- Revenues
- Untaxed Revenues
- Count
- Revenues
- Tick the boxes for the measures you want to view.
- All selected measures will be displayed in the pivot grid.
6. Use Different Chart Views
- Besides the line chart, you can switch to:
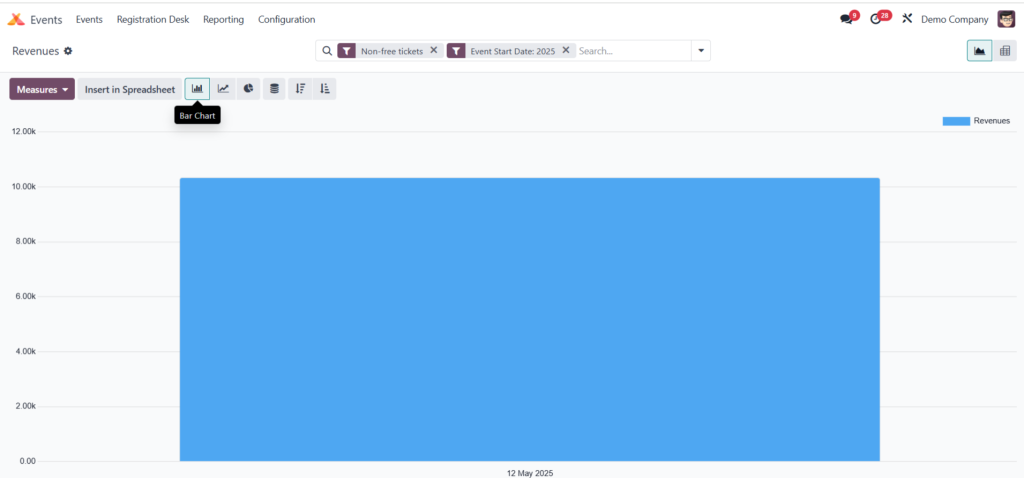
- Bar Chart
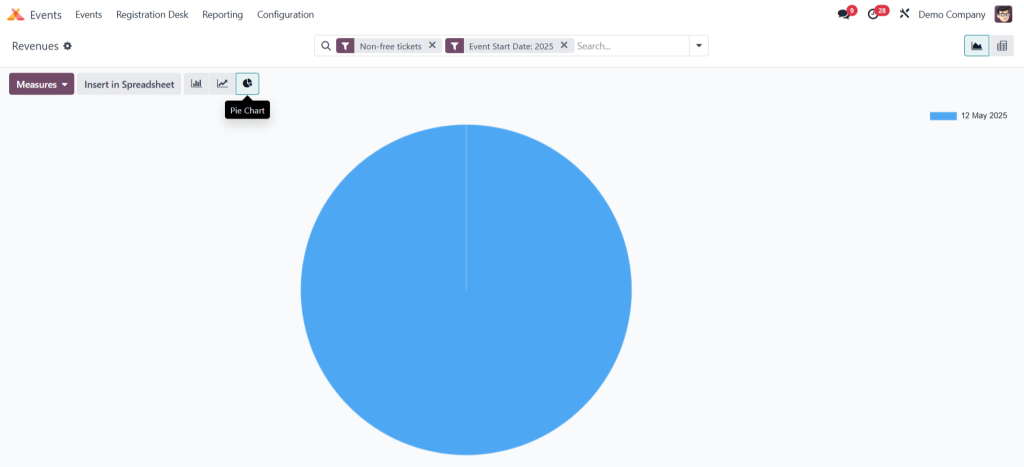
- Pie Chart
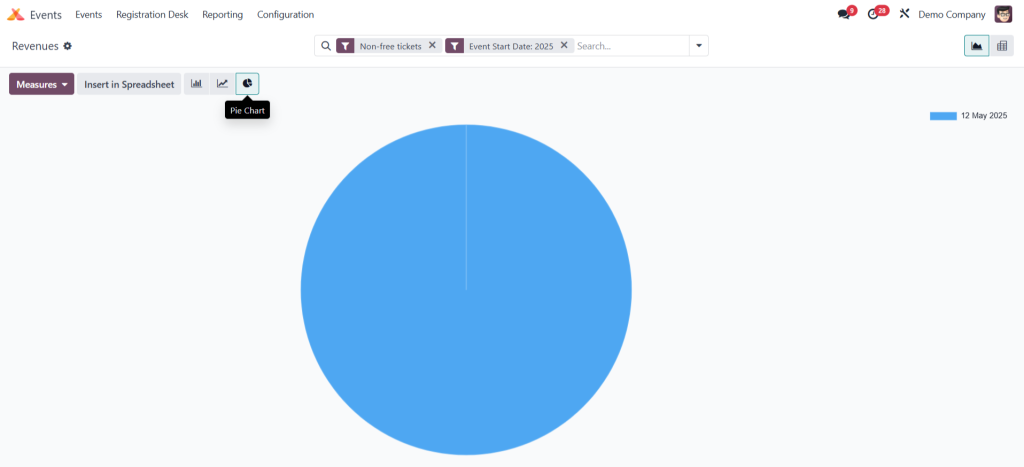
Cumulative Line Chart
7. Apply Filters and Groupings
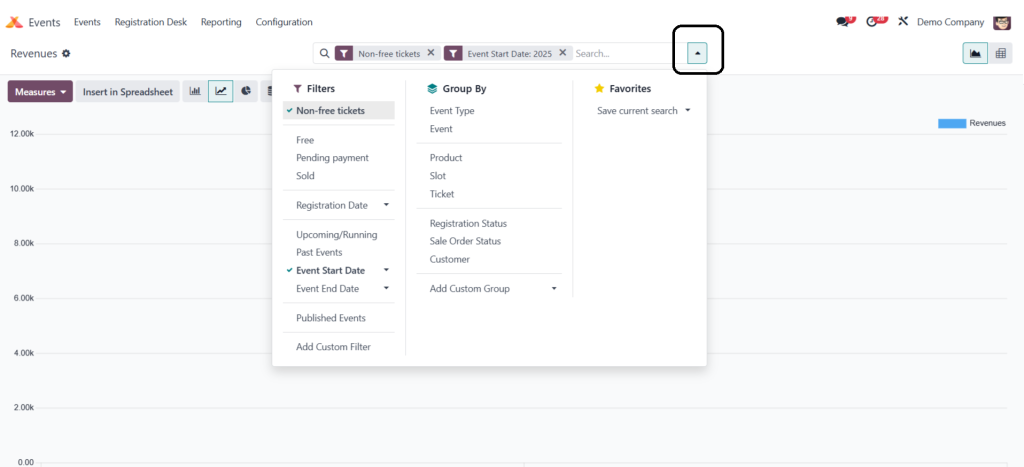
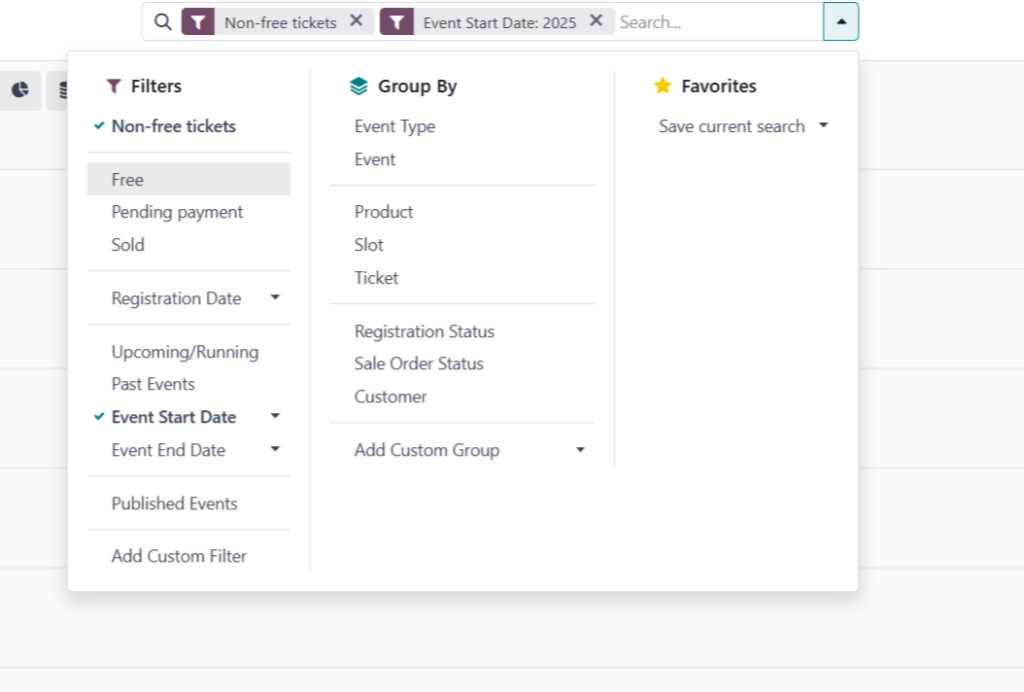
- Click the downward arrow in the search bar.
- Use dropdowns for:
- Filters
- Group By
- Favorites
- Filters
8. Available Filter Options
You can filter the report by:
- Ticket Type (Free, Non-Free)
- Payment Status (Pending, Sold)
- Registration Date
- Event Timing (Upcoming, Running, Past)
- Event Start/End Date
- Published Events
-
Custom Filters (as per need)
9. Grouping Options
You can group your report by:
- Event Type
- Event Name
- Product
- Ticket Type
- Registration Status
- Sale Order Status
- Customer
- Custom Groupings
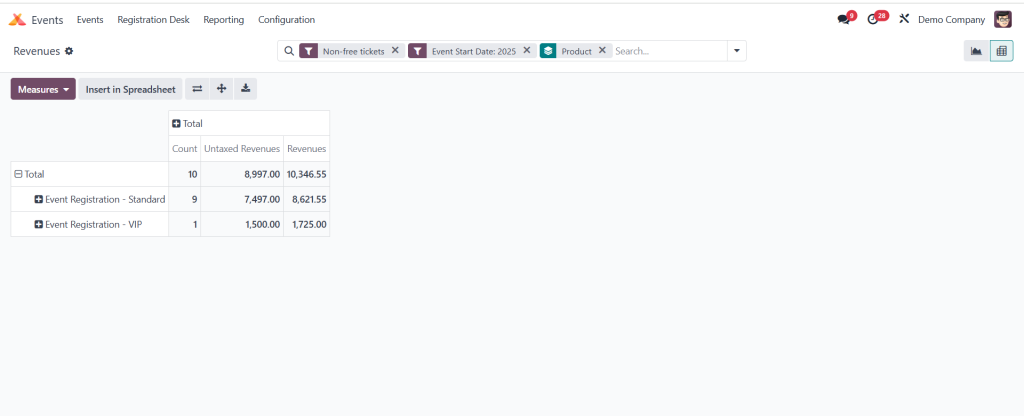
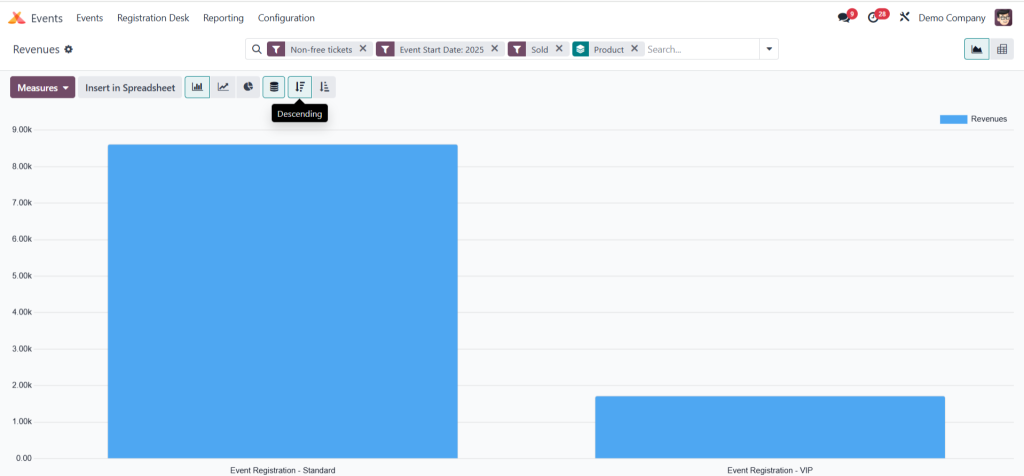
Example: Group by Product to see revenue per ticket type (e.g., Standard, VIP).
10. Example Use-Cases
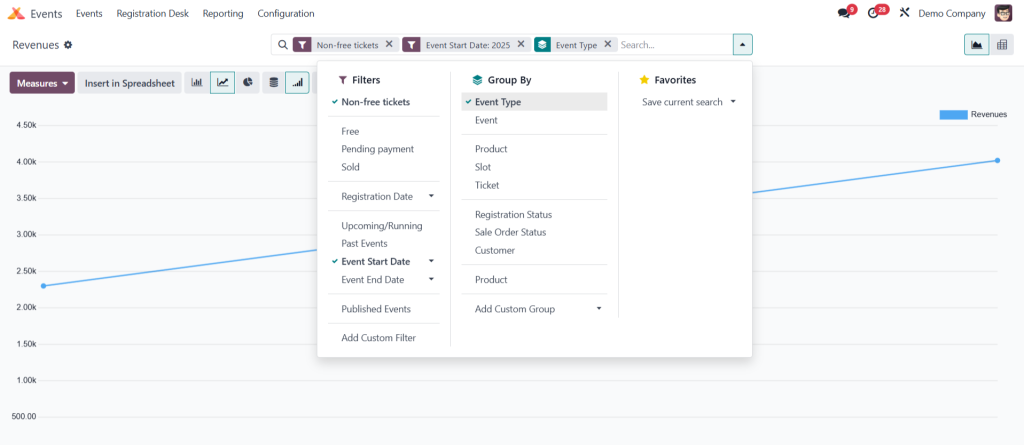
- Graph View: Analyze sold vs. free tickets for published events, grouped by event and ticket type.
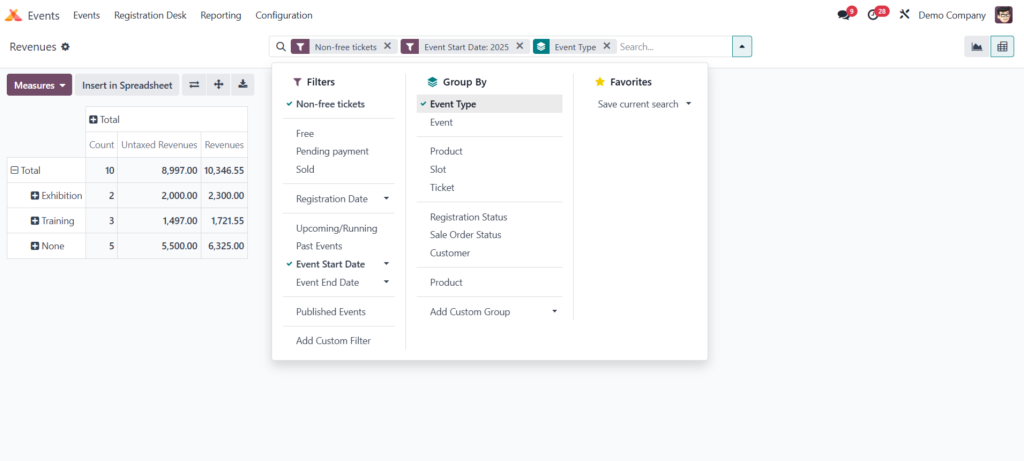
Pivot Table: View revenue generated by different event types.
11. View and Sort Data
- Sort data in ascending or descending order.
- Choose the appropriate graph type to represent your data visually.
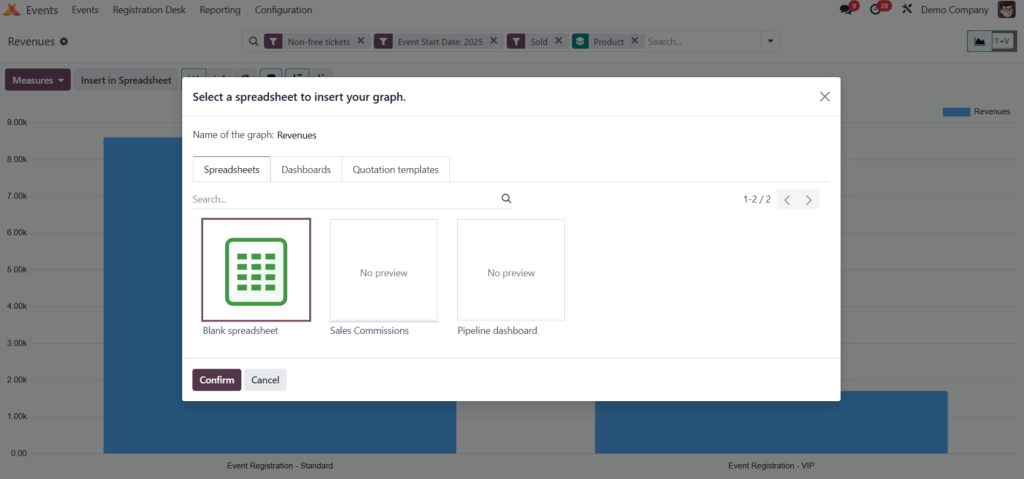
12. Export to Spreadsheet
- Insert the customized revenue report directly into a spreadsheet for further analysis or presentation.
Understanding the Revenue Report Interface
The revenue report interface in Odoo 18 is designed to provide a comprehensive view of your event’s financial performance. Key components include:
- Graph View: By default, the revenue report displays a line chart showing revenue trends.
- Pivot View: Switch to the pivot table view for a detailed breakdown of revenues by various dimensions such as event, ticket type, or date.
- Measures: Customize the data displayed by selecting different measures like “Revenues,” “Untaxed Revenues,” and “Count.”
- Filters and Grouping: Use filters to narrow down data by criteria such as event type, date range, or ticket category—group data to analyze revenues by specific segments.
Customizing the Revenue Report for Deeper Insights
Odoo 18 allows you to tailor the revenue report to meet your specific analytical needs:
- Applying Filters: Use filters to focus on specific events or time periods—for example, filter by “Non-free tickets” to analyze paid events only.
- Grouping Data: Group revenues by event, location, or ticket type to identify which segments perform best.
- Selecting Measures: To align with your analysis goals, choose relevant measures to display, such as total revenue or the number of tickets sold.
Leveraging the Revenue Report for Strategic Decisions
The insights gained from the Odoo 18 Events Revenue Report can inform various strategic decisions:
- Pricing Strategies: Analyze which ticket types generate the most revenue to adjust pricing accordingly.
- Marketing Efforts: Identify events with higher revenues to replicate successful marketing strategies.
- Resource Allocation: Allocate resources to events or segments that demonstrate higher profitability.
By regularly reviewing the revenue report, you can make data-driven decisions to enhance the success of your events.
Exporting and Sharing the Revenue Report
Odoo 18 provides options to export the revenue report for sharing and further analysis:
- Export to Excel: Click on the export icon to download the report in Excel format for offline analysis.
- Save Custom Reports: Save customized views of the report for quick access in the future.
- Share with Team: Share the report with team members to collaborate on event planning and analysis.
Enhancing Event Management with Odoo 18 Events Revenue Report
The Odoo 18 Events Revenue Report is a powerful tool that provides valuable insights into your events’ financial performance. By understanding how to access and customize this report, you can make informed decisions to improve your event strategies, optimize revenues, and ensure the success of future events.