Why Bottleneck Analysis Using Odoo 19 Dashboards Matters
Your organization requires a Bottleneck Analysis Using Odoo 19 Dashboards because it experiences delayed operations, recurring errors, delayed approval processes, and unorganized workflow systems. The new features of Odoo 19 enable businesses to detect operational issues through its real-time dashboard, enhanced reporting capabilities, and workflow visualization tools. Modern enterprises operate at such high speeds that they cannot afford to make educated guesses about operational problems. The solution provides data-based insights that match your requirements for Bottlenecks Analysis Using Odoo 19 Dashboards.
As companies increasingly depend on digital systems for sales, HR, accounting, supply chain, and project management, the need for more insightful workflows becomes essential. That’s why learning Bottlenecks Analysis Using Odoo 19 Dashboards is now a competitive advantage. Whether you run a small business or a large enterprise, understanding Bottlenecks Analysis Using Odoo 19 Dashboards helps you eliminate delays at their root. What makes this even more powerful is Odoo’s ability to give instant visibility into KPIs, throughput time, workload distribution, employee performance, and process inefficiencies.
This article will show you step-by-step how to perform Bottlenecks Analysis Using Odoo 19 Dashboards, why it matters, and how Netilligence, an Odoo Partner, can help you optimize your operations with precision. You’ll also learn how using Bottlenecks Analysis Using Odoo 19 Dashboards can transform your business into a faster, more scalable, and cost-efficient company.
What Is Bottleneck Analysis and Why Is It Crucial for Business Success?
A bottleneck refers to any step in your workflow that slows down the entire process. It could be:
- Slow approvals
- Manual repetitive tasks
- Overloaded employees
- Outdated systems
- Poor visibility
- Errors and rework
- Inventory delays
- Miscommunication
Bottleneck analysis helps you identify the exact point in your process where it’s stuck. Without this, you end up treating symptoms rather than solving the root problem.
If you’re new to dashboards, you can also read our detailed guide on How to Create Powerful Dashboards in Odoo to understand the fundamentals before diving into bottleneck analysis.
How Odoo 19 Dashboards Make Bottleneck Analysis Easier
Odoo 19 introduces highly interactive, easy-to-use dashboards that help executives and managers monitor performance without technical expertise. These dashboards combine Odoo real-time business analytics with visually appealing widgets that make bottleneck identification incredibly simple.
Key features that make Odoo perfect for workflow bottleneck analysis
- Real-time charts & updated KPIs
- Advanced filters to isolate delays
- Intelligent view switching (list, pivot, graph)
- AI-driven forecasting & suggestions
- Customized dashboard reports
- Department-specific analytics
Whether you’re analyzing Sales, CRM, Inventory, Projects, Manufacturing, or HR operations, Odoo dashboards deliver crystal clear visibility.
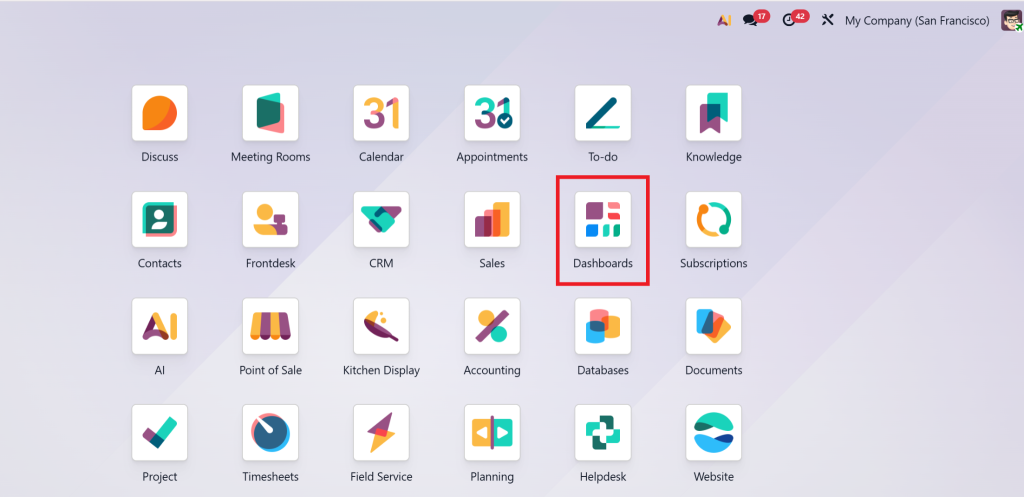
Step-by-Step Guide to Performing Bottleneck Analysis Using Odoo 19 Dashboards
Below is a detailed process for running a complete bottleneck analysis in Odoo 19.
Step 1 – Identify Which Process or Department to Analyze
Before opening any dashboard, first determine the target area where delays commonly occur:
- Sales cycle
- Lead conversion process
- Manufacturing orders
- Purchase approvals
- Inventory receipts
- HR recruitment
- Payroll processing
- Project task progress
Once the problem area is selected, head to that module’s dashboard.
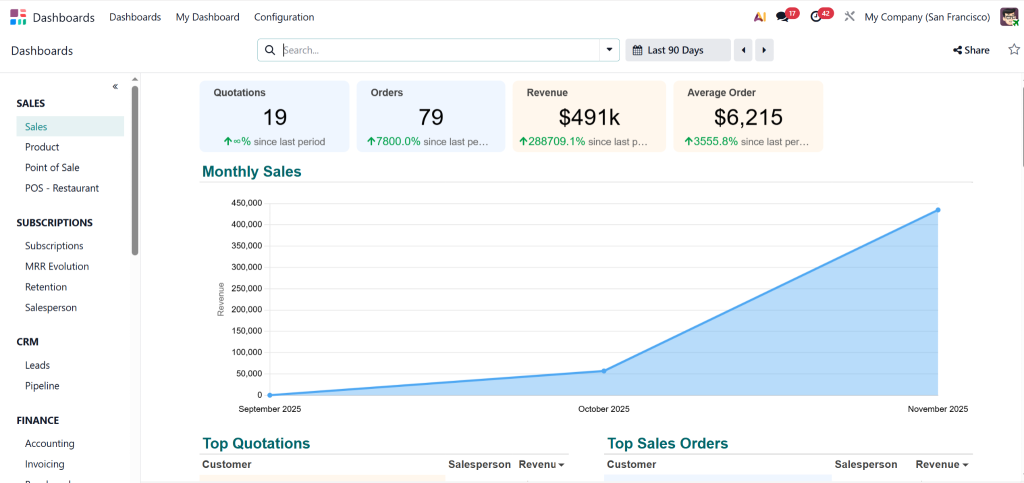
Step 2 – Analyze Throughput Time and Task Aging
Odoo 19 dashboards show average task completion time, a powerful indicator of bottlenecks.
You can instantly identify:
- Stages where tasks stay for too long
- Departments with the slowest cycle times
- Employees facing overload
- Days with high task accumulation
Use filtering options to compare:
✔ Week vs. Month
✔ Employee vs. Team
✔ Task type vs. Task priority
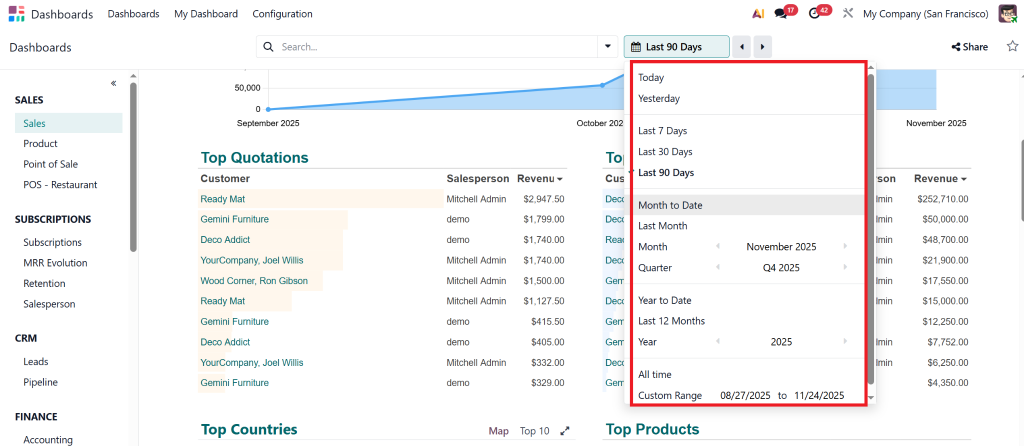
This is a significant part of the Odoo bottleneck identification process.
Step 3 – Track KPIs Using the Odoo Dashboard KPI Tracking Tools
The KPI tiles inside Odoo dashboards give you instant clarity on:
- Number of pending tasks
- Processing time
- Delay duration
- Overdue tasks
- Rework percentage
- Customer complaints
- Inventory mismatch
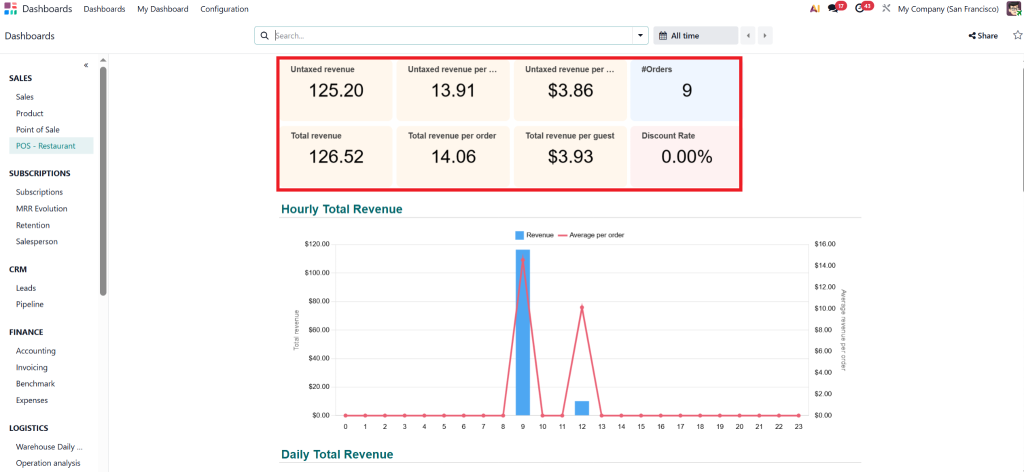
This is where Odoo dashboard KPI tracking supports fast decision-making.
Step 4 – Use Pivot Tables for Deeper Workflow Bottleneck Analysis in Odoo
The pivot table view in Odoo 19 serves as a vital tool for data segmentation. The tool enables users to perform comparisons between:
- Employee workloads
- Stage durations
- Approver delays
- Product-specific issues
- Vendor performance trends
Users can export pivot table data to Excel for performing complex data analysis.
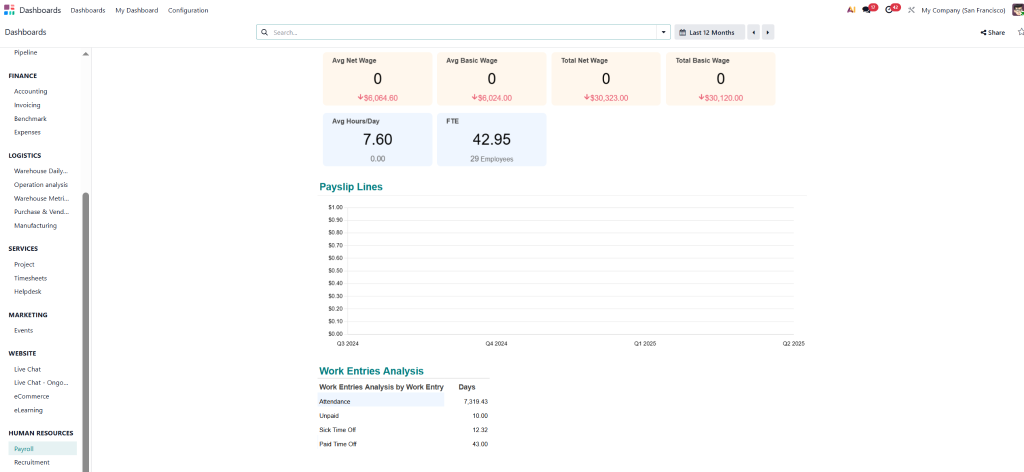
The method serves as a standard approach for identifying workflow bottlenecks in Odoo systems.
Step 5 – Visualize Delays with Graph Views
Odoo’s graph view provides quick insights using:
- Line charts
- Bar charts
- Pie charts
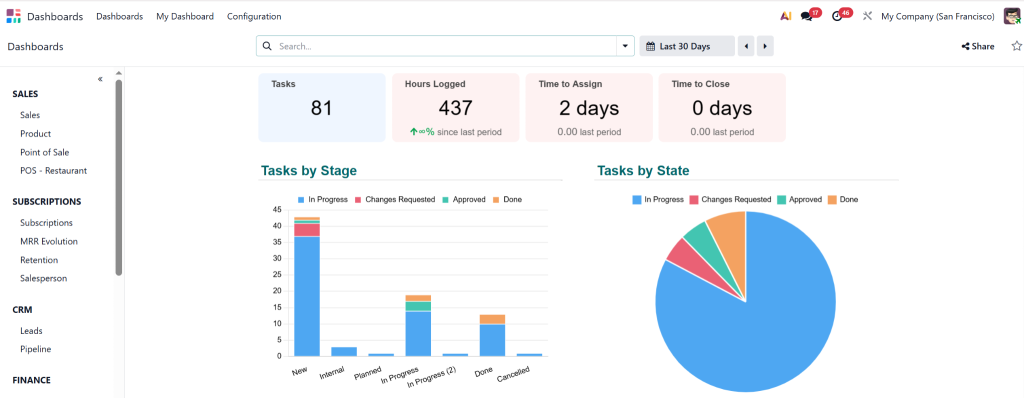
These charts help identify sudden spikes or drops in performance, making bottleneck reporting in Odoo 19 much more accurate.
Step 6 – Create Automated Bottleneck Reports Using Odoo
You can schedule automated reports to be sent daily, weekly, or monthly. These reports help teams stay proactive and detect bottlenecks before they affect business performance.
Use automated reports for:
- Sales bottlenecks
- Manufacturing delays
- Late task approvals
- Employee performance issues
- Quality control failures
Step 7 – Apply Process Optimization Using Odoo Dashboard Insights
Once bottlenecks are identified, Odoo 19 allows you to redesign workflows:
- Add more automation
- Reduce manual approvals
- Reassign overloaded tasks
- Improve communication loops
- Set reminders & triggers
- Modify stages for faster processing
This complete cycle of identifying, analyzing, and optimizing is what makes the Odoo dashboard process optimization so effective.
Benefits of Bottleneck Analysis Using Odoo 19 Dashboards
1. Faster Workflow and Production
Eliminating delays improves customer satisfaction.
2. Lower Cost of Operations
Your business operations become more cost-effective through process optimization and waste reduction.
3. Higher Employee Productivity
Employees achieve better results through improved work methods that provide clear visibility and proper workload distribution.
4. Data-Driven Decision Making
Real-time analytics enable managers to respond quickly to data.
5. Increased Scalability
The process optimization enables your business to expand its operations without experiencing operational breakdowns.
6. Better Quality Control
Dashboard patterns enable early detection of quality problems.
7. Complete Transparency Across Departments
The system reveals all delays and blockers that previously went unnoticed by staff members.
Practical Examples of Using Odoo 19 Dashboards for Bottleneck Reporting
1. Sales Team Bottleneck Example
The KPI in Odoo shows how many commercial proposals remain in the “Negotiation” stage for extended periods. Managers can start taking immediate action.
2. Manufacturing Bottleneck Example
The Odoo system indicates task accumulation when the assembling stage contains excessive pending work orders.
3. Inventory Bottleneck Example
The Odoo dashboards display longer lead times when vendor issues cause receipt delays.
4. Project Management Bottleneck Example
The Odoo system displays high task aging when developers handle more work than they can manage.
Why Choose Netilligence for Odoo Bottleneck Analysis & Dashboard Implementation?
As an Odoo Partner, Netilligence brings years of experience in:
- Implementing Odoo dashboards
- Customizing workflow analytics
- Automating bottleneck detection
- Building advanced KPI dashboards
- Optimizing business processes
- Providing dedicated training and support
How Netilligence Helps You:
✔ Custom dashboard design
✔ Real-time KPI monitoring setup
✔ Automated bottleneck reporting
✔ Industry-based workflow optimization
✔ Odoo 19 performance improvements
✔ Full implementation + support
When you work with Netilligence, you don’t just get software,
You get a transformation partner committed to making your operations smoother, faster, and more profitable.
Start Eliminating Bottlenecks with Odoo 19 Today
Performing Bottlenecks Analysis Using Odoo 19 Dashboards is not just a technical activity; it’s a business survival strategy. Companies that adopt intelligent dashboards and real-time analytics gain a massive advantage over competitors who still rely on guesswork.
If you want to:
- Speed up your processes
- Cut delays
- Improve customer satisfaction
- Use data for decision-making
- Scale operations smoothly
- Increase overall efficiency
Then Odoo 19 dashboards are the answer.
And with Netilligence as your trusted Odoo Partner, you will have experts who guide, support, and optimize your systems to achieve long-term success.
Lorem ipsum dolor sit amet, consectetur adipiscing elit. Ut elit tellus, luctus nec ullamcorper mattis, pulvinar dapibus leo.